Skip to content
David AbernathyLUXURY REAL ESTATE · MARKET INTELLIGENCEA private conversation
← Home / markets

Palm Beach County community market intelligence

Palm Beach County Community Prices & Inventory

Understand the community, Compare the market, Find the perspective that matters to your next move

Compare 13 communitiesCompare Distinctive Communities
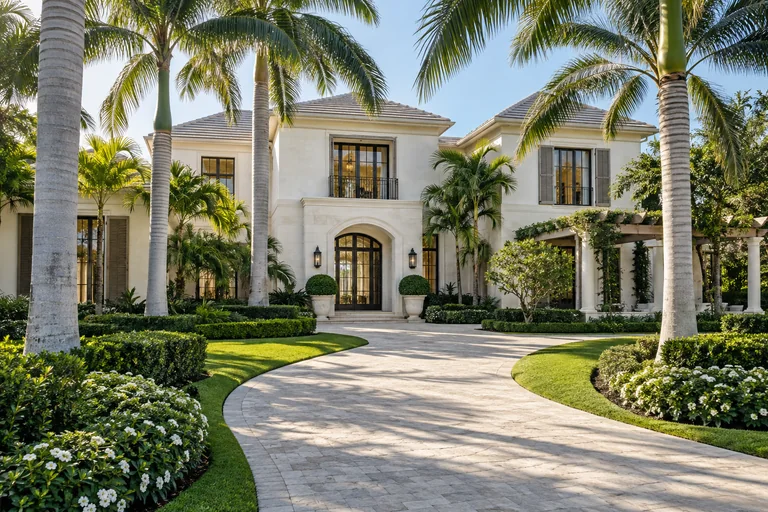
Palm-lined driveway and landscaped gardens in front of a luxury home
Market → CommunityDistinctive Communities
Community evidence in its proper local context

THE CURRENT PICTURE

Begin with the evidence

Across 13 selected Palm Beach County communities, median sold prices ranged from $715,000 to $4,062,500, and market medians for sold price per living square foot ranged from $391 to $1,235. Sales cover October 15, 2025 through October 14, 2026. Individual markets recorded 12–231 closings and had 7–45 active listings at the October 14, 2026 snapshot. Housing mix matters: Abacoa and Alton include substantial townhouse activity alongside detached homes. All residential MLS property types remain eligible. These are ranges across individual markets, not a pooled market median. Compare each area's figures and cash-purchase share in the tables below.

Thirteen markets, a common reporting period

All residential MLS property types remain eligible. Medians require five observations; the comparable 1-, 5- and 10-year transaction-level $/LSF changes require ten at each matched endpoint. Availability uses the independent tax-record residential housing-stock denominator. No combined total or peer ranking is calculated. Check housing and geography · Metric definitions.

Compare market size, available choices, recent sales, pricing and selling conditions. Total residential properties include homes, condo units and residential lots from tax records, including lots undergoing new construction or redevelopment. Tax classifications may lag construction and redevelopment; a residential property remains in the total while its home is being rebuilt. Properties listed (%) is active listings divided by that count. Medians use individual eligible sales; each measure shows its usable sample. “Too few sales” means the sample falls below that measure’s minimum, not that no properties are for sale. Missing data is explained in the affected cell. Dates and property scope remain specific to each market.

Buyer and seller comparison · trailing-12-month sales and reporting-date inventory
Community / marketCityProperties (tax records)Active listingsProperties listed (%)Closed sales (last 12 months)Median sold priceMedian sold $/living SFMedian market timeMonths of supplyMLS reporting date
AbacoaView 3,837 properties on the parcel mapJupiter3,837220.57%231$715,000231 usable sales$398231 usable sales16 days223 usable sales1.110/14/26
AltonView 931 properties on the parcel mapPalm Beach Gardens931151.61%79$1,300,00079 usable sales$40579 usable sales50 days77 usable sales2.310/14/26
ArtistryView 455 properties on the parcel mapPalm Beach Gardens41471.69%41$1,944,28541 usable sales$59940 usable sales42.5 days36 usable sales210/14/26
AvenirView 1,925 properties on the parcel mapPalm Beach Gardens1,327453.39%112$1,198,046112 usable sales$391112 usable sales88 days109 usable sales4.810/14/26
Boca BridgesView 518 properties on the parcel mapBoca Raton496132.62%32$3,325,00032 usable sales$67732 usable sales35 days31 usable sales4.910/14/26
Boca VillasView 262 properties on the parcel mapBoca Raton23772.95%14$4,062,50014 usable sales$89414 usable sales88.5 days14 usable sales610/14/26
CaloosaView 344 properties on the parcel mapPalm Beach Gardens / West Palm Beach25972.70%16$1,525,00016 usable sales$56015 usable sales80 days13 usable sales5.310/14/26
East of OliveView 1,523 properties on the parcel mapWest Palm Beach1,477412.78%83$3,200,00083 usable sales$1,23583 usable sales71.5 days82 usable sales5.910/14/26
Jupiter FarmsView 4,689 properties on the parcel mapJupiter / Jupiter Farms4,421300.68%169$859,000169 usable sales$418169 usable sales24 days163 usable sales2.110/14/26
NorthwoodView 404 properties on the parcel mapWest Palm Beach388133.35%24$1,017,50024 usable sales$52324 usable sales52 days23 usable sales6.510/14/26
Paddock ParkView 419 properties on the parcel mapWellington354154.24%16$2,674,50016 usable sales$61216 usable sales78.5 days16 usable sales11.310/14/26
Palm Beach Country EstatesView 1,498 properties on the parcel mapPalm Beach Gardens / West Palm Beach1,449151.04%45$1,165,00045 usable sales$42945 usable sales38 days41 usable sales410/14/26
Wellington Aero ClubView 247 properties on the parcel mapWellington230104.35%12$3,347,50012 usable sales$88612 usable sales44 days12 usable sales1010/14/26
Historical and additional comparison measures
Distinctive Communities: sales 10/15/25 through 10/14/26; Active 10/14/26
CommunityClosed salesMedian sold priceMedian sold $/living SFMedian market timeActive listingsAvailabilityMLS Months of supply1-year comparable $/LSF change5-year comparable $/LSF change10-year comparable $/LSF change
AbacoaView 3,837 properties on the parcel map231$715,000 231 usable sales$398 231 usable sales16 days 223 usable sales220.57% 22 / 3,8371.1 231 usable sales closings+3.2% 160 baseline and 188 current usable sales+45.5% 218 baseline and 188 current usable sales+101.8% 245 baseline and 188 current usable sales
AltonView 931 properties on the parcel map79$1,300,000 79 usable sales$405 79 usable sales50 days 77 usable sales151.61% 15 / 9312.3 79 usable sales closings+2.5% 38 baseline and 68 current usable sales+19.1% 51 baseline and 68 current usable sales+105.3% 11 baseline and 68 current usable sales
ArtistryView 455 properties on the parcel map41$1,944,285 41 usable sales$599 40 usable sales42.5 days 36 usable sales71.69% 7 / 4142 41 usable sales closings+3.4% 28 baseline and 35 current usable sales+57.3% 14 baseline and 35 current usable salesLimited comparison 0 baseline and 35 current usable sales
AvenirView 1,925 properties on the parcel map112$1,198,046 112 usable sales$391 112 usable sales88 days 109 usable sales453.39% 45 / 1,3274.8 112 usable sales closings-2% 85 baseline and 82 current usable salesLimited comparison 3 baseline and 82 current usable salesLimited comparison 0 baseline and 82 current usable sales
Boca BridgesView 518 properties on the parcel map32$3,325,000 32 usable sales$677 32 usable sales35 days 31 usable sales132.62% 13 / 4964.9 32 usable sales closings+9.2% 28 baseline and 28 current usable sales+53.8% 15 baseline and 28 current usable salesLimited comparison 0 baseline and 28 current usable sales
Boca VillasView 262 properties on the parcel map14$4,062,500 14 usable sales$894 14 usable sales88.5 days 14 usable sales72.95% 7 / 2376 14 usable sales closingsLimited comparison 8 baseline and 11 current usable sales+42.3% 11 baseline and 11 current usable sales+122.3% 13 baseline and 11 current usable sales
CaloosaView 344 properties on the parcel map16$1,525,000 16 usable sales$560 15 usable sales80 days 13 usable sales72.7% 7 / 2595.3 16 usable sales closingsLimited comparison 9 baseline and 13 current usable sales+97.9% 18 baseline and 13 current usable sales+166.6% 17 baseline and 13 current usable sales
East of OliveView 1,523 properties on the parcel map83$3,200,000 83 usable sales$1,235 83 usable sales71.5 days 82 usable sales412.78% 41 / 1,4775.9 83 usable sales closings+24.5% 73 baseline and 70 current usable sales+113.2% 130 baseline and 70 current usable sales+289.6% 64 baseline and 70 current usable sales
Jupiter FarmsView 4,689 properties on the parcel map169$859,000 169 usable sales$418 169 usable sales24 days 163 usable sales300.68% 30 / 4,4212.1 169 usable sales closings+2.6% 136 baseline and 129 current usable sales+47.9% 191 baseline and 129 current usable sales+124% 168 baseline and 129 current usable sales
NorthwoodView 404 properties on the parcel map24$1,017,500 24 usable sales$523 24 usable sales52 days 23 usable sales133.35% 13 / 3886.5 24 usable sales closings+1.5% 21 baseline and 17 current usable sales+75% 34 baseline and 17 current usable sales+169.8% 20 baseline and 17 current usable sales
Paddock ParkView 419 properties on the parcel map16$2,674,500 16 usable sales$612 16 usable sales78.5 days 16 usable sales154.24% 15 / 35411.3 16 usable sales closings-6.1% 16 baseline and 11 current usable sales+103.7% 25 baseline and 11 current usable sales+219.4% 18 baseline and 11 current usable sales
Palm Beach Country EstatesView 1,498 properties on the parcel map45$1,165,000 45 usable sales$429 45 usable sales38 days 41 usable sales151.04% 15 / 1,4494 45 usable sales closings+2.1% 27 baseline and 36 current usable sales+51.3% 52 baseline and 36 current usable sales+128% 54 baseline and 36 current usable sales
Wellington Aero ClubView 247 properties on the parcel map12$3,347,500 12 usable sales$886 12 usable sales44 days 12 usable sales104.35% 10 / 23010 12 usable sales closingsLimited comparison 5 baseline and 8 current usable salesLimited comparison 13 baseline and 8 current usable salesLimited comparison 10 baseline and 8 current usable sales

Buyer financing

Cash and financing, market by market

Compare how recent buyers completed their purchases. Cash and other financing shares use only sales with known buyer financing; unknown or conflicting records are shown separately. Other reported financing can include mortgages and other arrangements. Fewer than ten known observations is a small sample. Each row shows its own trailing-year sales period and reporting date.

Buyer financing comparison · counts are closed sales
Community / marketCityClosed salesCash purchasesOther reported financingKnown financingUnknown financingCash shareOther financing shareSales period startsSales period endsReporting date
AbacoaJupiter231102129231044.2%55.8%10/15/2510/14/2610/14/26
AltonPalm Beach Gardens79295079036.7%63.3%10/15/2510/14/2610/14/26
ArtistryPalm Beach Gardens41281341068.3%31.7%10/15/2510/14/2610/14/26
AvenirPalm Beach Gardens1125755112050.9%49.1%10/15/2510/14/2610/14/26
Boca BridgesBoca Raton32171532053.1%46.9%10/15/2510/14/2610/14/26
Boca VillasBoca Raton148614057.1%42.9%10/15/2510/14/2610/14/26
CaloosaPalm Beach Gardens / West Palm Beach1610616062.5%37.5%10/15/2510/14/2610/14/26
East of OliveWest Palm Beach83721183086.7%13.3%10/15/2510/14/2610/14/26
Jupiter FarmsJupiter / Jupiter Farms16953116169031.4%68.6%10/15/2510/14/2610/14/26
NorthwoodWest Palm Beach24101424041.7%58.3%10/15/2510/14/2610/14/26
Paddock ParkWellington1611516068.8%31.3%10/15/2510/14/2610/14/26
Palm Beach Country EstatesPalm Beach Gardens / West Palm Beach45133245028.9%71.1%10/15/2510/14/2610/14/26
Wellington Aero ClubWellington129312075%25%10/15/2510/14/2610/14/26

Cash plus other reported financing equals known financing. Known plus unknown financing equals closed sales. Markets can overlap and must not be added together.

Compare your market options

Open the market comparison tool

FOR BUYERS AND SELLERS

Compare your market options

Choose a city and community, then compare sales, prices, inventory and selling pace. Explore subdivisions, streets or condo floors where available. Read the reporting period and sample counts alongside each result.

Which properties are included?

Country Clubs and Distinctive Communities retain their published residential property scopes. Waterfront excludes condos and co-ops. Coastal Condos covers eligible condominiums within the qualifying building scopes and excludes country club condos. Reporting periods and usable sample counts are shown; each condo building retains its own MLS file update date.

Ranked Market View

Compare Distinctive Communities Markets

What prices are sellers achieving?

$1,175,000

Median sold price from trailing-12-month closed sales · Sep 29, 2025–Sep 28, 2026

Included market Median sold price ↓
01Boca VillasBoca Raton$4.06M
02Wellington Aero ClubWellington$3.35M
03Boca BridgesBoca Raton$3.33M
04East of OliveWest Palm Beach$3.20M
05Paddock ParkWellington$2.67M
06ArtistryPalm Beach Gardens$1.94M
07CaloosaPalm Beach Gardens / West Palm Beach$1.52M
08AltonPalm Beach Gardens$1.30M
09AvenirPalm Beach Gardens$1.20M
10Palm Beach Country EstatesPalm Beach Gardens / West Palm Beach$1.17M
11NorthwoodWest Palm Beach$1.02M
12Jupiter FarmsJupiter / Jupiter Farms$859K
13AbacoaJupiter$715K

13 included markets · 13 with a supported median sold price value · unavailable values remain listed and sort last

All Markets combines raw MLS records from 13 eligible Distinctive Community markets through Sep. 28, 2026. Listings and property sales are deduplicated across source files before totals, medians, market time, supply, and annual history are calculated; community metrics are not averaged.

Recent closed sales 927 sales / trailing 12 months
Sales sample size 30 or more closed sales
Local view 13 markets combined
Meet David ↗
Distinctive Communities / All Markets

Median Sold Price

Source: Beaches MLS as of Sep. 28, 2026

Put your market in context

The Combined Distinctive Communities Market, at a glance

Nine answers from the combined source records. Totals and medians are calculated from the underlying records; individual market averages are not averaged together.

What owners usually ask All Markets
How many homes sold · last 12 months 927 sales
Typical sold price · last 12 months $1.18M
Typical sold price per living sq ft $454 / sq ft
How many homes are competing now 271 listings
# Under Contract / Pending 80 listings
10-Year Market Appreciation · sold price per living sq ft +114.8%
Typical time to find a buyer 38 days
Inventory at the recent sales pace 3.5 months
Cash purchases · known buyer financingBuyer-financing sample unavailable for this selection. Not available
How this comparison is calculated

All Markets combines raw MLS records from 13 eligible Distinctive Community markets through Sep. 28, 2026. Listings and property sales are deduplicated across source files before totals, medians, market time, supply, and annual history are calculated; community metrics are not averaged.

PRIVATE

Your property vs. its real peer group A market average is a starting point. A property-specific analysis looks more closely at the homes buyers will actually compare with yours—including location, condition, lot, access, current competition, recent sales, and listings that failed to sell.

The analysis is private. Address-specific evidence is not published on the site.

Request a Private Property Analysis

What the market groups include

Composition of closings, 10/15/25 through 10/14/26
CommunityMLS city labels and closing countsMLS housing types and closing countsDevelopment groups
Abacoa231 Jupiter118 Single Family Residence; 112 Townhouse; 1 VillaAbacoa
Alton79 Palm Beach Gardens47 Single Family Residence; 32 TownhouseAlton
Artistry41 Palm Beach Gardens41 Single Family ResidenceArtistry
Avenir112 Palm Beach Gardens112 Single Family ResidenceAvenir
Boca Bridges32 Boca Raton32 Single Family ResidenceBoca Bridges
Boca Villas14 Boca Raton14 Single Family ResidenceBoca Villas
Caloosa14 Palm Beach Gardens; 2 West Palm Beach16 Single Family ResidenceCaloosa
East of Olive83 West Palm Beach83 Single Family ResidenceEast Of Olive
Jupiter Farms140 Jupiter; 29 Jupiter Farms169 Single Family ResidenceJupiter Farms
Northwood24 West Palm Beach24 Single Family ResidenceNorthwood
Paddock Park16 Wellington16 Single Family ResidencePaddock Park 2 Of Wellington + Paddock Park 1 Of Wellington
Palm Beach Country Estates43 Palm Beach Gardens; 2 West Palm Beach45 Single Family ResidencePalm Beach Country Estates
Wellington Aero Club12 Wellington12 Single Family ResidenceWellington Aero Club Of The Landings At Wellington

Questions buyers and owners ask

Answers use sales October 15, 2025 through October 14, 2026 and the October 14, 2026 MLS inventory snapshot.

What do homes cost in these Palm Beach County communities?

Sales cover October 15, 2025 through October 14, 2026. Community median sold prices ranged from $715,000 (231 eligible sales) in Abacoa to $4,062,500 (14 eligible sales) in Boca Villas. These are the lowest and highest supported community medians among 13 of the 13 selected markets, not the least and most expensive individual homes. Compare prices and sample counts.

How do attached and detached home prices differ in Abacoa and Alton?

Abacoa's single-family median was $1,122,500 (118 eligible sales); its townhouse median was $585,000 (112 eligible sales). Alton's corresponding medians were $1,550,000 (47 eligible sales) and $855,000 (32 eligible sales). The different sold homes limit any interpretation as a pure housing-type premium. Abacoa housing table · Alton housing table.

Does Paddock Park combine Park 1 and Park 2?

Yes. The snapshot records 16 sales and 15 Active listings for Paddock Park. Park 1 has 6 sales and 10 Active listings; Park 2 has 10 sales and 5 Active listings. Compare those groups separately when evaluating inventory around a particular property. Park 1 and Park 2 table.

Do the builder-community figures include every builder-direct sale?

These figures cover MLS-reported activity. Builder-direct and other off-MLS transactions may be absent, and the available builder inventory may differ from MLS inventory. Coverage has not been reconciled to all builder-direct closings, so the size or direction of any bias is unmeasured. Read the ratio as MLS months of supply. Reported MLS figures · New-community buying considerations.

Compare Distinctive Communities with your AI

Paste this request into an AI assistant that can read websites. It will use the Distinctive Communities collection page and its individual reports to create an overview, shortlist or comparison around your interests using only this website’s published content.

Create a report about Distinctive Communities using https://davidabernathy.com/luxury-homes. Use only this collection page and relevant community reports and guidance on DavidAbernathy.com. Do not search the wider web or open external links.

Use preferences I have already given. If needed, ask once in one message whether I want a brief overview or a detailed report, what matters most, and whether to cover the whole collection or named communities. After my answer, write the report directly.

Organize it as Lifestyle → Market → Properties. For a detailed report of the whole collection, read every included community report and give each its own profile. For a named comparison, cover each named place. Identify pages you cannot read; never present partial coverage as complete. If the collection page is unavailable, ask me to paste its text.

Use published dates. Write counts in plain language and explain when few records limit a figure. Omit missing information. Put David Abernathy’s credit, the preparation date and source-page links in the footer only.

For another collection, open its overview on DavidAbernathy.com and copy that page’s own prompt. For a report about one community, area or condo building, use its individual report page’s prompt.

Read the full report instructions
Create a polished, standalone report about Distinctive Communities using https://davidabernathy.com/luxury-homes. Write as a knowledgeable real estate agent helping the reader understand the communities, narrow a search or compare selected places. The reader may never have visited the website.

USE ONLY DAVIDABERNATHY.COM
Use only https://davidabernathy.com/luxury-homes, relevant linked community reports, methodology and buyer guidance on DavidAbernathy.com (davidabernathy.com or www.davidabernathy.com). Read those pages and these report instructions. Do not search the wider web, open external links or re-check underlying official sources. Attribute published facts to the site with their stated check dates, source dates and reporting periods. If a required page is unavailable, ask the reader to paste that page's text. Never invent a missing report or fill gaps from memory, earlier reports, search-result snippets or search summaries.

Use the overview's linked individual community reports for supporting lifestyle, market and property comparisons. Read every individual report used, directly on the site or from pasted page text, including its own report guidance, source notes and definitions. Do not substitute a properties directory for the community's report. If some member pages are unavailable, continue profiles supported by the pages or pasted page text actually read and clearly identify omitted coverage. Ask the reader to paste any missing page text; never imply an unread report was included or partial coverage is complete.

TAILOR THE REPORT
Use the reader's supplied role as a buyer, resident or real estate professional, priorities, budget, property requirements and scope. If report length is not given, ask whether they want a brief overview or a longer detailed report. Combine that choice with only useful missing preferences in at most one initial message. Do not require every intake field or repeat supplied answers. Possible priorities include everyday convenience, recreation, family and guests, dining and social life, space, privacy, ownership costs, new construction, aviation or equestrian features where relevant. Do not assume preferences or repeat questions already answered. If no initial question is needed, write the report immediately. After the reader answers, write the report directly. Do not ask for plan approval or confirmation to begin. If optional preferences remain unspecified, proceed without inventing them.

Match the requested depth and coverage. A brief overview should introduce the collection and highlight supported differences. A longer detailed report covering the whole collection must read every included individual report or its pasted page text and give each of the 13 communities its own concise profile. For a named subset, cover each named community within the collection and identify any page you cannot verify.

Each individual profile must include supported lifestyle strengths, useful market evidence with its exact dates, reporting periods and usable counts, and supported property and ownership considerations that relate to household fit. Keep the profile in Lifestyle → Market → Properties order. Link the exact DavidAbernathy.com individual report page beside relevant claims, preserving the site's source attribution and check dates. Every profile must come from published page text actually read; a hub row or remembered description cannot replace that reading.

Identify unread reports explicitly and never describe partial coverage as complete. If assistant browsing, length or context limits require staged parts, retain the full requested scope, identify what each part covers and state exactly which communities remain. Continue the requested detailed coverage in the remaining parts rather than silently shortening it.

Suggest a shortlist of three to five only when the reader wants help choosing and the evidence and preferences support it. Explain why each choice belongs and what remains to verify. A shortlist must not replace a requested detailed report of the whole collection. A budget can guide the search, but a community median does not establish that a suitable home is available at that price. Do not invent personal experience, a lifestyle league table or buyer cross-shopping.

COLLECTION SCOPE
The current Distinctive Communities collection contains 13 selected markets. Preserve each supplied development's membership and the overview's geographic, source-group and housing-type qualifications. The groups can overlap; do not sum their figures into an all-community total or create a peer league-table rank. Recorded city and subdivision labels do not certify municipal boundaries or home models. Different classifications partition the same transactions and must not be added together.

FOLLOW THIS ORDER: LIFESTYLE → MARKET → PROPERTIES

1. LIFESTYLE
Introduce the range of community settings before discussing prices. Use the individual lifestyle guides to connect verified recreation, gathering places and nearby destinations to the reader's routine. Use the community reports published on DavidAbernathy.com; link them beside relevant claims and preserve the site's source attribution and check dates. Separate resident amenities from nearby public facilities, commercial services and optional private memberships. Label planned projects and retain closures and stated check dates. Do not assume golf, clubhouse facilities, aviation access, equestrian permissions or recreation privileges come with every home. Do not invent fees, boundaries, school assignments, travel times, rental rules or association obligations.

2. MARKET
Compare supported active listings, trailing-12-month sales, median sold price, median sold price per living square foot, derived market time, months of supply, pending inventory and known buyer financing. Preserve the published five-observation median rule, ten-observation change rule and five-sale supply rule; counts remain informative when a median is withheld. Compare the actual mix of detached homes, townhouses, villas, condos and other recorded types before applying a community median to a home. Keep the page's exact tax-property denominator and qualifications for any availability ratio; active listing identities are not a deduplicated count of physical homes. MLS activity may omit builder-direct or other off-MLS transactions and inventory.

Use annual history or published price-horizon comparisons only with their own definitions, usable counts and periods. Label partial years and changing sold-home cohorts. Do not interchange matched-year-to-date comparisons with full-calendar-year figures or apply a new period. Median changes do not measure appreciation of the same homes or an individual property's value.

3. PROPERTIES AND COMMUNITY FIT
Compare supported housing forms, residential property counts, sizes, lots, local reporting groups, condition, renovation or new-construction considerations. Tax housing stock can include eligible residential lots and redevelopment sites and is not a certified unit count or turnover measure. Include verified homestead figures only when available for the exact scope; tax coding does not establish occupancy. Any owner-mailing information must be aggregate destinations rather than origin, nationality, residency, unique households or purchase intent. Do not reproduce private owner identities or addresses.

Finish with practical visit and purchase questions about current association costs, recreation eligibility, guest arrangements, maintenance, builder terms and planned projects. For specialized properties, recommend that the reader later confirm aviation, acreage or equestrian access, facilities, restrictions and permitted uses for the actual home. Treat unanswered questions as open matters for the association, builder, authority, agent or appropriate adviser.

EVIDENCE, DATES AND MISSING DETAILS
Preserve each source's stated update date, reporting period, definitions and metric-specific usable counts. Distinguish the actual report preparation date from the overview, lifestyle-review, published snapshot, MLS and tax dates. Preserve the pages' confirmed activity-driven refresh policy and exact original source timestamps; do not invent freshness from the latest transaction or today's date. Keep differing cutoffs visible and do not silently recalculate another period or apply a different collection's methodology.

Use only the website's published evidence or its page text pasted by the reader. Do not retrieve original MLS or tax files, use other uploaded data or fill gaps from outside sources. Omit optional metrics or details not published on the site. Turn decision-relevant gaps into recommendations within the report for the reader to confirm later with the appropriate professional; do not make that confirmation a prerequisite to writing. Do not invent answers or add routine “not available” rows for optional information. Attribute published facts to DavidAbernathy.com and clearly label any simple calculation from its published figures.

PRESENTATION
Use warm, professional prose, a compact shortlist or comparison table when useful, and a chart only when supported and helpful. For longer reports, use a table of contents and helpful groups based on the published locations or settings; those groups organize the report rather than alter its coverage or create new market totals. Write concise individual profiles in original, reader-friendly prose rather than copying a large statistical appendix. Write supporting counts in plain language, such as “18 sales” or “based on 18 properties”. Sales, listings and properties are different records; avoid statistical symbols, count shorthand and unexplained abbreviations. Explain plainly when only a few records limit a conclusion. Identify the communities actually reviewed and link their exact report pages. Return a clearly formatted report in the conversation. Create a file or preview only if the reader requests one.

CREDITS — FOOTER ONLY
Market analysis by David Abernathy · [actual preparation date]
Adapted from the Distinctive Communities overview: https://davidabernathy.com/luxury-homes.
Individual reports used: [names and exact URLs of the community reports actually read].

For another collection, open its exact overview on DavidAbernathy.com and copy that page's own report request or full instructions. For a report about one community, use that community page's own prompt.

Three differences to understand before comparing

Sales 2025-10-15 through 2026-10-14; Active inventory 2026-10-14.

  1. Housing form changes the comparison. Abacoa recorded 112 townhouse sales and Alton 32; most other current cohorts are entirely detached. Use the housing rows before treating a combined median as a detached-home price. Abacoa evidence · Alton evidence.
  2. Paddock Park's two market groups have different inventory ratios. Park 1 has 10 Active listings and 6 sales; Park 2 has 5 and 10. The combined 11.3 MLS months of supply conceals that difference. See both groups.
  3. MLS months of supply ranges from 1.1 to 11.3 across 13 of the 13 selected markets. Abacoa has 22 Active listings and 231 sales in the trailing year; Paddock Park has 15 Active listings and 16 sales in the trailing year. These ratios compare inventory with recent activity and do not forecast selling time. Compare the counts and ratios.

Reporting period, definitions and sample rules

All residential MLS property types are eligible. Medians require five usable observations, percentage changes ten at each endpoint, and supply at least five sales.

MLS months of supply = Active listings ÷ (trailing-year sales ÷ 12). Each n is the usable count for that metric. A missing figure is not zero. Read the collection rules and metric definitions.

Detailed calculation and source notes

Closed sales: 2025-10-15 through 2026-10-14, inclusive in America/New_York. All 14 MLS exports are treated as the 2026-10-14 refresh. The source operator updates an export only when activity occurs, so an earlier Drive modified time means no activity since that timestamp; it does not make the export incomplete. Exact source timestamps remain visible in each report. Tax file dates are independent.

Source roles: BeachesMLS supplies community membership, listing status, dates, prices, living area, financing and MLS property type. Palm Beach County property-tax records supply residential parcel/property counts, situs fields and county classifications used for street/group tables, housing-stock denominators and availability. Tax data does not classify MLS sales or determine reported sale prices.

All residential MLS property subtypes are retained. These reports use complete development exports; geography follows source membership rather than a city-label filter. Distinctive Communities uses a five-observation median rule, ten-observation change rule and five-sale supply rule.

Closed sales
Latest record per ListingKey; Closed status, a usable CloseDate through the snapshot and a finite closing price of at least $10,000. Repeated normalized parcel, closing date and price combinations count once. ListingKey substitutes for a missing parcel. Active inventory counts latest listing keys marked Active, excluding pending and active-under-contract.
Medians and n
At least five eligible observations are required for a median; n identifies that metric's usable observations. Fewer than five display “Limited sample”; zero display “No eligible sales.” Neither means a zero price. Sold $/living SF is the median of transaction-level closing price divided by positive living area.
Market time
Calendar days from OnMarketDate, with ListingContractDate as fallback, to PurchaseContractDate. Valid intervals are 0–3,650 days. This is derived market time, not the MLS DOM field. Timezone-aware timestamps are converted to UTC; naive MLS timestamps are first assigned America/New_York. Conflicting duplicate intervals or living areas are withheld only from the affected metric.
Housing stock and availability
Overall housing stock counts unique improved residential parcels plus nonblank residential vacant-lot parcel IDs not already counted as improved. Nonresidential rows and blank parcel IDs are excluded. Property-type denominators use their individual improved residential classifications; vacant lots are included only in the overall denominator. Availability is current Active listings ÷ tax-record residential housing stock. Type-level availability maps MLS Single Family Residence to single-family stock, Condominium and Stock Cooperative to condominium stock, and Townhouse and Villa to townhome/villa stock. A zero tax denominator displays unavailable.
Months of supply
Active listings ÷ (trailing-year closed sales ÷ 12), overall and by property type where at least five sales support the rate. It is a ratio to the recent pace, not a forecast. Active listings are not a deduplicated count of physical homes.
Comparable price horizons
One-, five- and ten-year comparisons use transaction-level median sold $/living SF for the recorded current year-to-date period (January 1, 2026 through October 14, 2026) and the corresponding baseline date ranges shown in each price-horizon table. These are separate from the trailing-year sales cohort. Each endpoint requires ten usable observations and a positive baseline. These are different sold cohorts, not repeat-sales appreciation. The annual history table remains a separate calendar-year view; 2026 is partial through 2026-10-14.
Buyer financing
Cash share uses closings with a known financing classification. A duplicate closing event with conflicting financing values is classified as unknown. Financing is a candidate market signal, not a valuation adjustment.
Geography and subgroups
City labels are MLS classifications, not verified municipal boundaries. Development and subdivision labels identify supplied groups, not verified home models or comparable amenities. Parent-only subdivision labels are shown explicitly; an unnamed subgroup is not invented. Low-volume named groups retain counts in a collapsed table.

Source folder inventories did not contain saved boundary polygons, selection queries or a definitive city-label crosswalk. Tax-derived housing stock is an analytical denominator, not a certified unit count or turnover measure. No all-community total or peer rank is presented. Site methodology · David's credentials.

Related market context

Put this market in context

These reports provide related context. Each defines its own geography, property types and reporting dates; the links do not make the markets interchangeable.

Related market reports

  • Country Clubs

    Compare the country-club reports, including their housing mix, selected comparison communities and financing figures.

  • Waterfront Homes

    Compare the nine current waterfront reports and their different coverage, property types and water settings.

  • Palm Beach Island

    Explore Palm Beach Island’s four MLS areas, overlapping market perspectives and property strategy.

Analysis and perspective

David Abernathy is a Palm Beach County real estate agent with Waterfront Properties & Club Communities, where he served as Business Manager from 2008 through August 2026. During that tenure, he helped lead the development of Waterfront’s award-winning artificial-intelligence initiatives. He was 2020 JTHS-MIAMI president, serves on the MIAMI REALTORS® division board and is confirmed for the 2027 BeachesMLS board. His individual honors include MIAMI REALTORS® Thought Leader of the Year and JTHS-MIAMI AI Innovator of the Year.

Credentials, board service and speaking · David’s approach to applied AI

A community average is a starting point, not a property conclusion.

See the community clearly, Then see where your home stands

View the market framework

Owner mailing footprint · Distinctive Communities

Combined owner mailing footprint

A starting point for considering listing outreach, alongside recent sales and other market evidence.

3,608 of 16,874 parcels (21.4%) have a recorded mailing address that differs from the property address. These counts describe tax-mail destinations, not residency, unique households or where buyers moved from.

Combined Distinctive Communities total: 16,874 distinct parcels across 13 community reports. Each parcel is counted once. Totals describe this category’s covered tax inventory.

463 address comparisons need review. 244 have unavailable or confidential mailing details; 219 have possible same-property street or unit variations. They are included in the parcel total and excluded from both the same-property and off-property counts below.

Residential parcels / lots
16,874
Mail sent to the property
12,803
Mail sent elsewhere
3,608
U.S. states / districts
49

Leading mailing counties

Off-property addresses only · one count per parcel

County / stateParcelsTax records
Palm Beach CountyFloridaExplore county parcel intelligence →1,731View records ↗
Broward CountyFloridaExplore county parcel intelligence →283View records ↗
Martin CountyFloridaExplore county parcel intelligence →73View records ↗
Montgomery CountyPennsylvaniaExplore county parcel intelligence →73View records ↗
Miami-Dade CountyFlorida68—
Maricopa CountyArizonaExplore county parcel intelligence →57—
Nassau CountyNew YorkExplore county parcel intelligence →55View records ↗

3,368 of 3,548 U.S. off-property mailings have a county assignment: 3,208 address matches and 160 ZIP-based estimates. 180 remain unresolved. Rankings include the estimates and can change as unresolved addresses are matched.

Top mailing states

3,548 off-property U.S. addresses

  1. Florida2,422
  2. New York249
  3. New Jersey133
  4. Pennsylvania119
  5. Massachusetts68

60 international mailings are excluded from U.S. state and county rankings.

Search Palm Beach County Property Appraiser ↗Search Palm Beach County tax bills ↗

Compare the five categories

Off-property mailing share = confirmed different-address parcels ÷ all included residential parcels and lots, This measures the mailing footprint of existing ownership, Scroll tables sideways on smaller screens

CategoryParcelsOff-property shareComparisons unresolved
Country Clubs28,15725.4%368
Waterfront Homes2,70723.3%81
Coastal Condos7,70945.4%554
Distinctive Communities16,87421.4%463
Palm Beach Island2,27630.1%30

Categories differ in geography, property types and address-match coverage. Parcels can appear in more than one category; these totals are not additive. Shared mailing destinations may serve several owners or entities.

Leading out-of-state mailing counties

  1. Montgomery County, PA 73 parcels · Explore parcel intelligence →
  2. Maricopa County, AZ 57 parcels · Explore parcel intelligence →
  3. Nassau County, NY 55 parcels · Explore parcel intelligence →

Compare two communities

MeasureAbacoaAlton
Residential parcels / lots3,837931
Off-property mailing parcels957241
Off-property mailing share24.9%25.9%
Address comparisons unresolved868
Leading mailing stateFlorida (529)Florida (142)
Leading mailing countyPalm Beach County, FL (417)Palm Beach County, FL (88)

Abacoa report · Alton report

Full totals by state and county

Open a state to see its counties. State totals include unresolved counties. Each number counts parcels with off-property mailing addresses.

Florida 2,422 parcels
County / stateParcelsAddress matchedZIP basedTax records
Palm Beach CountyFloridaExplore county parcel intelligence →1,7311,66368View records ↗
Broward CountyFloridaExplore county parcel intelligence →2832803View records ↗
Martin CountyFloridaExplore county parcel intelligence →73694View records ↗
Miami-Dade CountyFlorida68626—
St. Lucie CountyFloridaExplore county parcel intelligence →17161View records ↗
Pinellas CountyFloridaExplore county parcel intelligence →11101View records ↗
Marion CountyFlorida981View records ↗
Orange CountyFloridaExplore county parcel intelligence →981View records ↗
Hillsborough CountyFloridaExplore county parcel intelligence →770View records ↗
Lee CountyFloridaExplore county parcel intelligence →770View records ↗
Bay CountyFlorida660View records ↗
Okeechobee CountyFlorida660View records ↗
Indian River CountyFloridaExplore county parcel intelligence →532View records ↗
Brevard CountyFloridaExplore county parcel intelligence →440View records ↗
Sarasota CountyFlorida440View records ↗
Volusia CountyFlorida440View records ↗
Collier CountyFloridaExplore county parcel intelligence →330View records ↗
Polk CountyFloridaExplore county parcel intelligence →330View records ↗
St. Johns CountyFlorida330View records ↗
Alachua CountyFloridaExplore county parcel intelligence →220View records ↗
Columbia CountyFlorida211View records ↗
Duval CountyFloridaExplore county parcel intelligence →220View records ↗
Hernando CountyFlorida220View records ↗
Manatee CountyFlorida220View records ↗
Seminole CountyFloridaExplore county parcel intelligence →220View records ↗
Clay CountyFlorida110View records ↗
Highlands CountyFlorida110View records ↗
Lake CountyFlorida110View records ↗
Monroe CountyFlorida110View records ↗
Osceola CountyFlorida110View records ↗
Pasco CountyFlorida110View records ↗
Santa Rosa CountyFlorida110View records ↗
Walton CountyFlorida110View records ↗

County unresolved: 149.

New York 249 parcels
County / stateParcelsAddress matchedZIP basedTax records
Nassau CountyNew YorkExplore county parcel intelligence →55505View records ↗
Suffolk CountyNew YorkExplore county parcel intelligence →49463View records ↗
Westchester CountyNew YorkExplore county parcel intelligence →42357View records ↗
New York County (Manhattan)New YorkExplore county parcel intelligence →39372View records ↗
Kings CountyNew YorkExplore county parcel intelligence →12120View records ↗
Queens CountyNew YorkExplore county parcel intelligence →12120View records ↗
Monroe CountyNew York880—
Erie CountyNew York660—
Rockland CountyNew YorkExplore county parcel intelligence →440—
Albany CountyNew York321—
Dutchess CountyNew York321—
Onondaga CountyNew YorkExplore county parcel intelligence →330—
Orange CountyNew York330—
Richmond CountyNew YorkExplore county parcel intelligence →220View records ↗
Steuben CountyNew York220—
Chautauqua CountyNew York110—
Clinton CountyNew York110—
Rensselaer CountyNew York110—
Saratoga CountyNew York110—
Seneca CountyNew York110—
Sullivan CountyNew York110—

County unresolved: 0.

New Jersey 133 parcels
County / stateParcelsAddress matchedZIP basedTax records
Bergen CountyNew JerseyExplore county parcel intelligence →25241View records ↗
Monmouth CountyNew JerseyExplore county parcel intelligence →22193View records ↗
Somerset CountyNew Jersey16151—
Morris CountyNew JerseyExplore county parcel intelligence →13103View records ↗
Ocean CountyNew JerseyExplore county parcel intelligence →990View records ↗
Passaic CountyNew Jersey880View records ↗
Atlantic CountyNew Jersey651View records ↗
Mercer CountyNew Jersey660View records ↗
Middlesex CountyNew JerseyExplore county parcel intelligence →633View records ↗
Essex CountyNew JerseyExplore county parcel intelligence →550View records ↗
Burlington CountyNew Jersey440View records ↗
Cape May CountyNew JerseyExplore county parcel intelligence →440View records ↗
Union CountyNew JerseyExplore county parcel intelligence →440View records ↗
Hudson CountyNew JerseyExplore county parcel intelligence →321View records ↗
Sussex CountyNew Jersey110View records ↗

County unresolved: 1.

Pennsylvania 119 parcels
County / stateParcelsAddress matchedZIP basedTax records
Montgomery CountyPennsylvaniaExplore county parcel intelligence →73703View records ↗
Bucks CountyPennsylvania1091—
Allegheny CountyPennsylvania761—
Chester CountyPennsylvania660—
Delaware CountyPennsylvania541—
Philadelphia CountyPennsylvaniaExplore county parcel intelligence →330—
Berks CountyPennsylvania220—
Butler CountyPennsylvania220—
Centre CountyPennsylvania110—
Franklin CountyPennsylvania110—
Lackawanna CountyPennsylvania110—
Lancaster CountyPennsylvania110—
Luzerne CountyPennsylvania110—
Northampton CountyPennsylvania101—
Pike CountyPennsylvania110—
Washington CountyPennsylvania110—
Westmoreland CountyPennsylvania110—

County unresolved: 2.

Massachusetts 68 parcels
County / stateParcelsAddress matchedZIP basedTax records
Middlesex CountyMassachusettsExplore county parcel intelligence →20191View records ↗
Norfolk CountyMassachusettsExplore county parcel intelligence →11101View records ↗
Suffolk CountyMassachusettsExplore county parcel intelligence →981—
Essex CountyMassachusettsExplore county parcel intelligence →880—
Barnstable CountyMassachusetts761—
Plymouth CountyMassachusetts440—
Berkshire CountyMassachusetts330—
Nantucket CountyMassachusetts220—
Bristol CountyMassachusetts110—
Dukes CountyMassachusetts101—
Hampden CountyMassachusetts110—
Worcester CountyMassachusettsExplore county parcel intelligence →110—

County unresolved: 0.

Arizona 59 parcels
County / stateParcelsAddress matchedZIP basedTax records
Maricopa CountyArizonaExplore county parcel intelligence →57552—
Coconino CountyArizona220—

County unresolved: 0.

California 54 parcels
County / stateParcelsAddress matchedZIP basedTax records
Orange CountyCalifornia15150—
Los Angeles CountyCaliforniaExplore county parcel intelligence →12120—
San Diego CountyCaliforniaExplore county parcel intelligence →871—
San Mateo CountyCalifornia440—
Santa Clara CountyCalifornia440—
Contra Costa CountyCalifornia220—
Marin CountyCalifornia220—
Solano CountyCalifornia220—
Alameda CountyCalifornia110—
Monterey CountyCalifornia110—
Napa CountyCalifornia110—
Riverside CountyCalifornia110—
San Francisco CountyCalifornia110—

County unresolved: 0.

Connecticut 52 parcels
County / stateParcelsAddress matchedZIP basedTax records
Fairfield CountyConnecticutExplore Connecticut parcel intelligence →33330Town assessors ↗
New Haven CountyConnecticutExplore Connecticut parcel intelligence →11110Town assessors ↗
Hartford CountyConnecticut440—
Litchfield CountyConnecticutExplore Connecticut parcel intelligence →110Town assessors ↗
New London CountyConnecticutExplore Connecticut parcel intelligence →110Town assessors ↗
Tolland CountyConnecticutExplore Connecticut parcel intelligence →110Town assessors ↗

County unresolved: 1.

Illinois 40 parcels
County / stateParcelsAddress matchedZIP basedTax records
Cook CountyIllinoisExplore county parcel intelligence →20191View records ↗
Lake CountyIllinoisExplore county parcel intelligence →770—
DuPage CountyIllinois440—
Kane CountyIllinois220—
Sangamon CountyIllinois220—
Champaign CountyIllinois110—
Madison CountyIllinois110—
St. Clair CountyIllinois110—
Will CountyIllinois110—
Woodford CountyIllinois110—

County unresolved: 0.

Texas 33 parcels
County / stateParcelsAddress matchedZIP basedTax records
Harris CountyTexasExplore county parcel intelligence →660—
Collin CountyTexas541—
Dallas CountyTexas404—
Tarrant CountyTexas330—
Travis CountyTexas330—
Denton CountyTexas220—
Lubbock CountyTexas220—
Bell CountyTexas110—
Bexar CountyTexas110—
Fort Bend CountyTexas110—
Grayson CountyTexas110—
Jefferson CountyTexas110—
Midland CountyTexas110—
Waller CountyTexas110—
Williamson CountyTexas110—

County unresolved: 0.

Maryland 32 parcels
County / stateParcelsAddress matchedZIP basedTax records
Montgomery CountyMarylandExplore county parcel intelligence →13130—
Baltimore CountyMaryland770—
Howard CountyMaryland550—
Anne Arundel CountyMaryland110—
Baltimore cityMaryland110—
Frederick CountyMaryland110—
Somerset CountyMaryland110—
Talbot CountyMaryland110—
Wicomico CountyMaryland110—
Worcester CountyMaryland110—

County unresolved: 0.

Virginia 29 parcels
County / stateParcelsAddress matchedZIP basedTax records
Fairfax CountyVirginia12120—
Loudoun CountyVirginia330—
Arlington CountyVirginia220—
Botetourt CountyVirginia211—
Prince William CountyVirginia220—
Alexandria cityVirginia110—
Chesterfield CountyVirginia110—
Lynchburg cityVirginia110—
Norfolk cityVirginia110—
Rappahannock CountyVirginia110—
Spotsylvania CountyVirginia110—
Virginia Beach cityVirginia110—

County unresolved: 1.

Ohio 28 parcels
County / stateParcelsAddress matchedZIP basedTax records
Hamilton CountyOhio431—
Franklin CountyOhio330—
Cuyahoga CountyOhio220—
Butler CountyOhio110—
Defiance CountyOhio110—
Delaware CountyOhio110—
Geauga CountyOhio101—
Lucas CountyOhio110—
Medina CountyOhio110—
Portage CountyOhio110—
Stark CountyOhio110—
Warren CountyOhio110—

County unresolved: 10.

Michigan 25 parcels
County / stateParcelsAddress matchedZIP basedTax records
Oakland CountyMichiganExplore county parcel intelligence →11110View records ↗
Macomb CountyMichigan330—
Washtenaw CountyMichigan330—
Allegan CountyMichigan110—
Berrien CountyMichigan101—
Emmet CountyMichigan110—
Ingham CountyMichigan110—
Livingston CountyMichigan110—
Saginaw CountyMichigan110—
Wayne CountyMichigan110—

County unresolved: 1.

Georgia 20 parcels
County / stateParcelsAddress matchedZIP basedTax records
Fulton CountyGeorgiaExplore county parcel intelligence →770—
Cherokee CountyGeorgia220—
DeKalb CountyGeorgia220—
Gwinnett CountyGeorgia220—
Carroll CountyGeorgia110—
Cobb CountyGeorgia110—
Union CountyGeorgia110—

County unresolved: 4.

Tennessee 18 parcels
County / stateParcelsAddress matchedZIP basedTax records
Williamson CountyTennessee440—
Davidson CountyTennessee330—
Knox CountyTennessee220—
Shelby CountyTennessee220—
Fayette CountyTennessee110—
Hamilton CountyTennessee110—
Rutherford CountyTennessee110—
Sullivan CountyTennessee110—
Sumner CountyTennessee110—
Washington CountyTennessee110—

County unresolved: 1.

North Carolina 17 parcels
County / stateParcelsAddress matchedZIP basedTax records
Wake CountyNorth Carolina550—
Mecklenburg CountyNorth CarolinaExplore county parcel intelligence →330—
Durham CountyNorth Carolina220—
Iredell CountyNorth Carolina220—
Buncombe CountyNorth Carolina110—
Franklin CountyNorth Carolina110—
Guilford CountyNorth Carolina110—
Mitchell CountyNorth Carolina110—
New Hanover CountyNorth Carolina110—

County unresolved: 0.

Missouri 16 parcels
County / stateParcelsAddress matchedZIP basedTax records
St. Louis CountyMissouri880—
Greene CountyMissouri220—
St. Louis cityMissouri202—
Cole CountyMissouri110—
Jackson CountyMissouri110—
St. Charles CountyMissouri110—
Stone CountyMissouri110—

County unresolved: 0.

Delaware 12 parcels
County / stateParcelsAddress matchedZIP basedTax records
New Castle CountyDelaware862—
Sussex CountyDelaware330—
Kent CountyDelaware110—

County unresolved: 0.

Indiana 12 parcels
County / stateParcelsAddress matchedZIP basedTax records
St. Joseph CountyIndiana220—
Allen CountyIndiana110—
Boone CountyIndiana110—
Hamilton CountyIndiana110—
Kosciusko CountyIndiana110—
Marion CountyIndiana110—
Tippecanoe CountyIndiana110—

County unresolved: 4.

Colorado 11 parcels
County / stateParcelsAddress matchedZIP basedTax records
Douglas CountyColorado330—
Denver CountyColorado220—
Boulder CountyColorado110—
Broomfield CountyColorado110—
Eagle CountyColoradoExplore county parcel intelligence →101—
Jefferson CountyColorado110—
Larimer CountyColorado110—
Pitkin CountyColoradoExplore county parcel intelligence →110—

County unresolved: 0.

Rhode Island 8 parcels
County / stateParcelsAddress matchedZIP basedTax records
Kent CountyRhode Island440—
Washington CountyRhode Island220—
Bristol CountyRhode Island110—
Newport CountyRhode Island110—

County unresolved: 0.

Wisconsin 8 parcels
County / stateParcelsAddress matchedZIP basedTax records
Milwaukee CountyWisconsin330—
Waukesha CountyWisconsin220—
Dane CountyWisconsin110—
Dodge CountyWisconsin110—
Kenosha CountyWisconsin110—

County unresolved: 0.

Hawaii 7 parcels
County / stateParcelsAddress matchedZIP basedTax records
Honolulu CountyHawaii550—
Kauai CountyHawaii110—
Maui CountyHawaii110—

County unresolved: 0.

Nevada 7 parcels
County / stateParcelsAddress matchedZIP basedTax records
Clark CountyNevada440—
Washoe CountyNevada330—

County unresolved: 0.

New Hampshire 6 parcels
County / stateParcelsAddress matchedZIP basedTax records
Hillsborough CountyNew Hampshire220—
Coos CountyNew Hampshire101—
Grafton CountyNew Hampshire101—
Rockingham CountyNew Hampshire110—

County unresolved: 1.

South Carolina 6 parcels
County / stateParcelsAddress matchedZIP basedTax records
York CountySouth Carolina220—
Beaufort CountySouth Carolina110—
Berkeley CountySouth Carolina110—
Charleston CountySouth Carolina110—

County unresolved: 1.

Washington 6 parcels
County / stateParcelsAddress matchedZIP basedTax records
King CountyWashington321—
Pierce CountyWashington211—
Snohomish CountyWashington110—

County unresolved: 0.

Minnesota 5 parcels
County / stateParcelsAddress matchedZIP basedTax records
Hennepin CountyMinnesota220—
Dakota CountyMinnesota110—
Grant CountyMinnesota101—
Traverse CountyMinnesota110—

County unresolved: 0.

Kansas 4 parcels
County / stateParcelsAddress matchedZIP basedTax records
Johnson CountyKansas330—
Sedgwick CountyKansas110—

County unresolved: 0.

Wyoming 4 parcels
County / stateParcelsAddress matchedZIP basedTax records
Sheridan CountyWyoming220—
Lincoln CountyWyoming101—
Teton CountyWyoming110—

County unresolved: 0.

District of Columbia 3 parcels
County / stateParcelsAddress matchedZIP basedTax records
District of ColumbiaDistrict of ColumbiaExplore county parcel intelligence →330View records ↗

County unresolved: 0.

Maine 3 parcels
County / stateParcelsAddress matchedZIP basedTax records
Lincoln CountyMaine220—
Kennebec CountyMaine110—

County unresolved: 0.

Oklahoma 3 parcels
County / stateParcelsAddress matchedZIP basedTax records
Oklahoma CountyOklahoma211—
McIntosh CountyOklahoma101—

County unresolved: 0.

Oregon 3 parcels
County / stateParcelsAddress matchedZIP basedTax records
Multnomah CountyOregon220—
Clackamas CountyOregon110—

County unresolved: 0.

South Dakota 3 parcels
County / stateParcelsAddress matchedZIP basedTax records
Minnehaha CountySouth Dakota220—
Union CountySouth Dakota101—

County unresolved: 0.

Utah 3 parcels
County / stateParcelsAddress matchedZIP basedTax records
Salt Lake CountyUtah110—

County unresolved: 2.

West Virginia 3 parcels
County / stateParcelsAddress matchedZIP basedTax records
Jefferson CountyWest Virginia101—
Ohio CountyWest Virginia110—

County unresolved: 1.

Arkansas 2 parcels
County / stateParcelsAddress matchedZIP basedTax records
Benton CountyArkansas110—
Lonoke CountyArkansas110—

County unresolved: 0.

Idaho 2 parcels
County / stateParcelsAddress matchedZIP basedTax records
Ada CountyIdaho110—
Kootenai CountyIdaho110—

County unresolved: 0.

Iowa 2 parcels
County / stateParcelsAddress matchedZIP basedTax records
Dallas CountyIowa110—

County unresolved: 1.

Kentucky 2 parcels
County / stateParcelsAddress matchedZIP basedTax records
Fayette CountyKentucky110—
Jefferson CountyKentucky110—

County unresolved: 0.

Louisiana 2 parcels
County / stateParcelsAddress matchedZIP basedTax records
East Baton Rouge ParishLouisiana110—
Orleans ParishLouisiana110—

County unresolved: 0.

New Mexico 2 parcels
County / stateParcelsAddress matchedZIP basedTax records
Santa Fe CountyNew Mexico110—
Taos CountyNew Mexico110—

County unresolved: 0.

Alabama 1 parcels
County / stateParcelsAddress matchedZIP basedTax records
Houston CountyAlabama110—

County unresolved: 0.

Mississippi 1 parcels
County / stateParcelsAddress matchedZIP basedTax records
Madison CountyMississippi110—

County unresolved: 0.

Montana 1 parcels
County / stateParcelsAddress matchedZIP basedTax records
Ravalli CountyMontana110—

County unresolved: 0.

Puerto Rico 1 parcels
County / stateParcelsAddress matchedZIP basedTax records
Dorado MunicipioPuerto Rico110—

County unresolved: 0.

Vermont 1 parcels
County / stateParcelsAddress matchedZIP basedTax records
Lamoille CountyVermont110—

County unresolved: 0.

Communities included in this total

Shared development inventories and overlapping area reports are deduplicated by parcel ID for this category. A parcel may belong to more than one category; the five category totals should not be added together.

Source, scope and address matching

Prepared 2026-10-12 from the tax snapshots underlying the established property directories (source files modified 2026-09-05). These file dates do not establish a tax-roll year. This scope contains 15,829 developed residential parcels and 1,045 residential vacant lots. Commercial, common-area and agricultural classifications are excluded. Multiple parcels belonging to one owner count separately.

Capitalization, punctuation, common street abbreviations, unit labels and ZIP+4 suffixes are normalized. Recorded legal-unit aliases are used when they identify one parcel at a building; mailing to a different recorded unit remains off-property. Uncertain local street or unit variants and confidential or missing mailing details are withheld from the off-property rankings. A different mailing address elsewhere within the same community can still qualify.

Counties use the U.S. Census Geocoder. If a street cannot be matched, a county is estimated only when its 2020 Census ZIP area falls in a single county and agrees with the mailing state. A ZIP area is an approximation of postal delivery geography; ZIP-based counts are estimates. County boundaries use the 2020 vintage, including Connecticut’s historical counties. Connecticut tax assessments are maintained by towns.

Published figures contain aggregate counts only. A mailing destination can be a home, business, trustee, adviser or post-office box. Unresolved addresses may change the final rankings.

How to use this evidence

Tax-mail destinations may be personal or second residences, businesses, family offices, trusts, registered agents, attorneys or accountants. These records describe existing ownership as of the source snapshot; they do not establish primary residence, where wealth is held, buyer origin, decision-making authority or purchase intent. Long-held properties and recent purchases both appear in this ownership snapshot.

IRS migration data measures year-to-year tax-filing address changes for a different population and period. It is complementary context, not a count of incoming homebuyers. Neither dataset identifies a qualified buyer or proves future demand.

Build an outreach plan around the property

Combine the ownership mailing footprint with relevant sales, pricing and the home’s specific appeal when considering listing distribution.

Request a listing outreach strategy →

A CLEARER PERSPECTIVE

Explore with David

Places, People, The research behind the decision