What do homes sell for?
—The middle sale price over the last 12 months.

THE PALM BEACH COUNTY COLLECTION
Exceptional places.
A clearer perspective.
Country clubs. Waterfront homes. Luxury communities.
Luxury real estate market intelligence for Palm Beach County.
18 Yearsat Waterfront Properties
1,000+Listing Presentations
Top-AgentCoaching
MarketingLeadership
01 / FOR PROPERTY OWNERS
Before you sell,
know where you stand.
Choose your community, then the question on your mind. See the answer, what it means for a seller, and the figures behind it. Explore subdivisions and individual streets where available.
Which properties are included?
Country clubs and distinctive communities cover all residential property types. The original seller reports below follow their published MLS community and street groups; some waterfront-area groups include other property types or neighboring areas. The additional community comparison uses Palm Beach County parcel matching and limits waterfront to single-family residences marked as waterfront.
Waterfront / Jupiter Waterfront
10-Year Market Appreciation
Source: Beaches MLS as of Sep. 14, 2026
How much competition would I face?
—
2017–2026 YTD change in annual median sold $/living sq ft
What this means for an ownerThe annual bars show how price per living square foot changed from year to year. Use the direction as market context, not as a forecast for an individual property.
Choose a market to see its sample size
How this compares with similar markets
Supporting comparison
Compared with similar markets
Position among peers
—
Typical peer
—
Middle result among supported peers
Difference from typical
—
Versus peer median
Ranked Market View
Compare Markets
| Included market | Selected metric |
|---|
See the supporting figures+
View the history as a chart
Select a market and metric to view its history.
Recent closed sales
See selected market
Sales sample size
See selected market
Local view
Jupiter
Meet David ↗
Broader source snapshot / property types may vary
Put your market in context
See what is typical.
Then see what is different.
See all seven answers for your selected market. The comparison columns show how it differs from other markets in the same collection.
What owners usually ask
Selected value
Position
Typical peer
Difference from typical
How many homes sold · last 12 months
—
—
—
—
Typical sold price · last 12 months
—
—
—
—
Typical sold price per living sq ft
—
—
—
—
How many homes are competing now
—
—
—
—
10-Year Market Appreciation · sold price per living sq ft
—
—
—
—
Typical time to find a buyer
—
—
—
—
Inventory at the recent sales pace
—
—
—
—
How this comparison is calculated
Select a market to see its source period, peer group and supporting comparisons.
PRIVATE
Your property vs. its real peer group A market average is a starting point. A property-specific analysis looks more closely at the homes buyers will actually compare with yours—including location, condition, lot, access, current competition, recent sales, and listings that failed to sell.
The analysis is private. Address-specific evidence is not published on the site.
Request a Private Property AnalysisCompare up to three communities
OPTIONAL / COMMUNITY COMPARISON
Put nearby markets
side by side.
Choose a community to see what homes have sold for, how much is available, and how quickly sold properties found a buyer.
All residential property types
Old Palm
Figures from the published market snapshot.
How much is available?
—Listings marked available in the source snapshot.How quickly are homes selling?
—Typical time from listing to contract for sold properties.Property type, size, condition and location all matter when applying these figures to a particular home.
Compare with another community
What homes sold for
Each bar starts at zero. Longer bars mean a higher price, more listings, or more days. The mix of properties can differ between communities.
Choose another community to see the differences side by side.
See more market details
Country clubs and distinctive communities include all residential property types. Waterfront includes single-family residences marked as waterfront in the MLS. The full community reports can cover a broader source group.
02 / EXPLORE THE COMMUNITIES
Three lifestyles.
One remarkable coast.
Explore the market reports for country clubs, waterfront homes and distinctive communities.
 01 / ON THE FAIRWAY
THE CLUB COLLECTION
Life, well played.
Country clubs & golf communities ↗ 02 / AT THE WATER’S EDGE
THE WATERFRONT COLLECTION
A different current.
River, Intracoastal & oceanfront ↗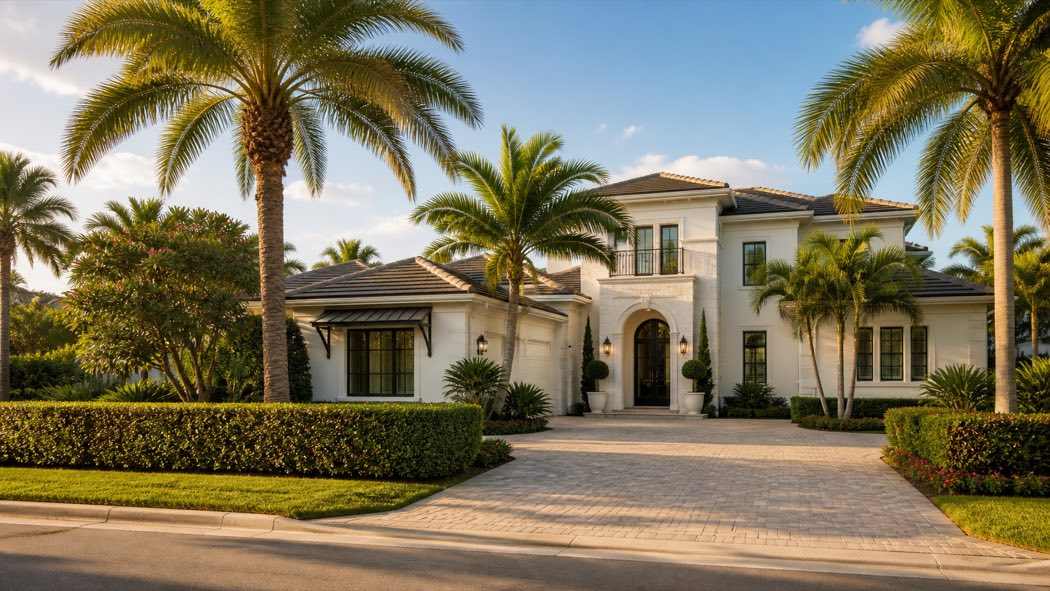 03 / ROOM TO BELONG
THE COMMUNITY COLLECTION
Your own kind of place.
Distinctive luxury communities ↗Lifestyle imagery illustrates each collection; it does not identify a property offered for sale.
04 / A MORE INFORMED PERSPECTIVE
Beautiful places.
Evidence you can inspect.
The right comparison.
Move from a collection to a community, then into the subdivisions and streets that make it distinct.
The numbers, explained.
See the source date, the time period, the formula and the size of the sales sample alongside the insight.
Context still matters.
A renovation, a golf membership or a boat’s route to the inlet can change the decision. A median cannot answer everything.
A FEW QUESTIONS WORTH ASKING
Before you
list your property.
How should a seller compare country-club properties?
Start with similar property types, locations and features. Then compare completed sales, competing listings and time to contract. The country-club comparison includes all residential property types, so look closer at the mix of homes in each community. Ask the club directly about membership eligibility, availability, fees and whether purchasing a home requires membership. A property purchase does not by itself establish membership.
What makes one waterfront home different from another?
Oceanfront, Intracoastal, river and canal settings offer different experiences. Boat draft, bridge clearance, water depth, dock permission and the route to an inlet require property-specific verification. Compare similar waterfront settings before treating a market median as a price benchmark.
Does a higher months-of-supply figure mean a home is overpriced?
No. Months of supply is the number of active listings divided by the average monthly pace of trailing closed sales. It describes supply relative to recent activity. It does not determine a particular home’s value or predict its selling time.
Does historical appreciation measure what my home gained?
No. The historical explorer compares annual median sold price per living square foot. Different homes sell in different years, and a partial current year is not a complete-year comparison. It is market context, not a repeat-sales index or an individual valuation.
The intelligence is analytical. The advice is personal.
Data has limits.
Good judgment knows where they are.
David Abernathy’s perspective comes from more than market data. For 18 years at Waterfront Properties & Club Communities, he has worked inside the strategy, marketing, and presentation of luxury real estate in Palm Beach County.
Luxury Listing Strategy
More than 1,000 listing presentations conducted for Waterfront Properties agents, including 100+ conducted with owner Rob Thomson.
Agent Coaching
Years spent coaching and working with many of Waterfront Properties’ top agents on listing strategy, presentation, marketing, and positioning.
Marketing Leadership
Experience leading the Waterfront Properties marketing team and helping translate a property’s competitive position into a marketing strategy.
Financial Perspective
Earlier leadership experience in wealth management and trust administration brings an additional perspective to consequential property and financial decisions.