Palm Beach · Market Intelligence
One island.
Several markets.
No useful average.
Data reveals the island’s direction, scarcity, and structure. Judgment explains the property the averages cannot.
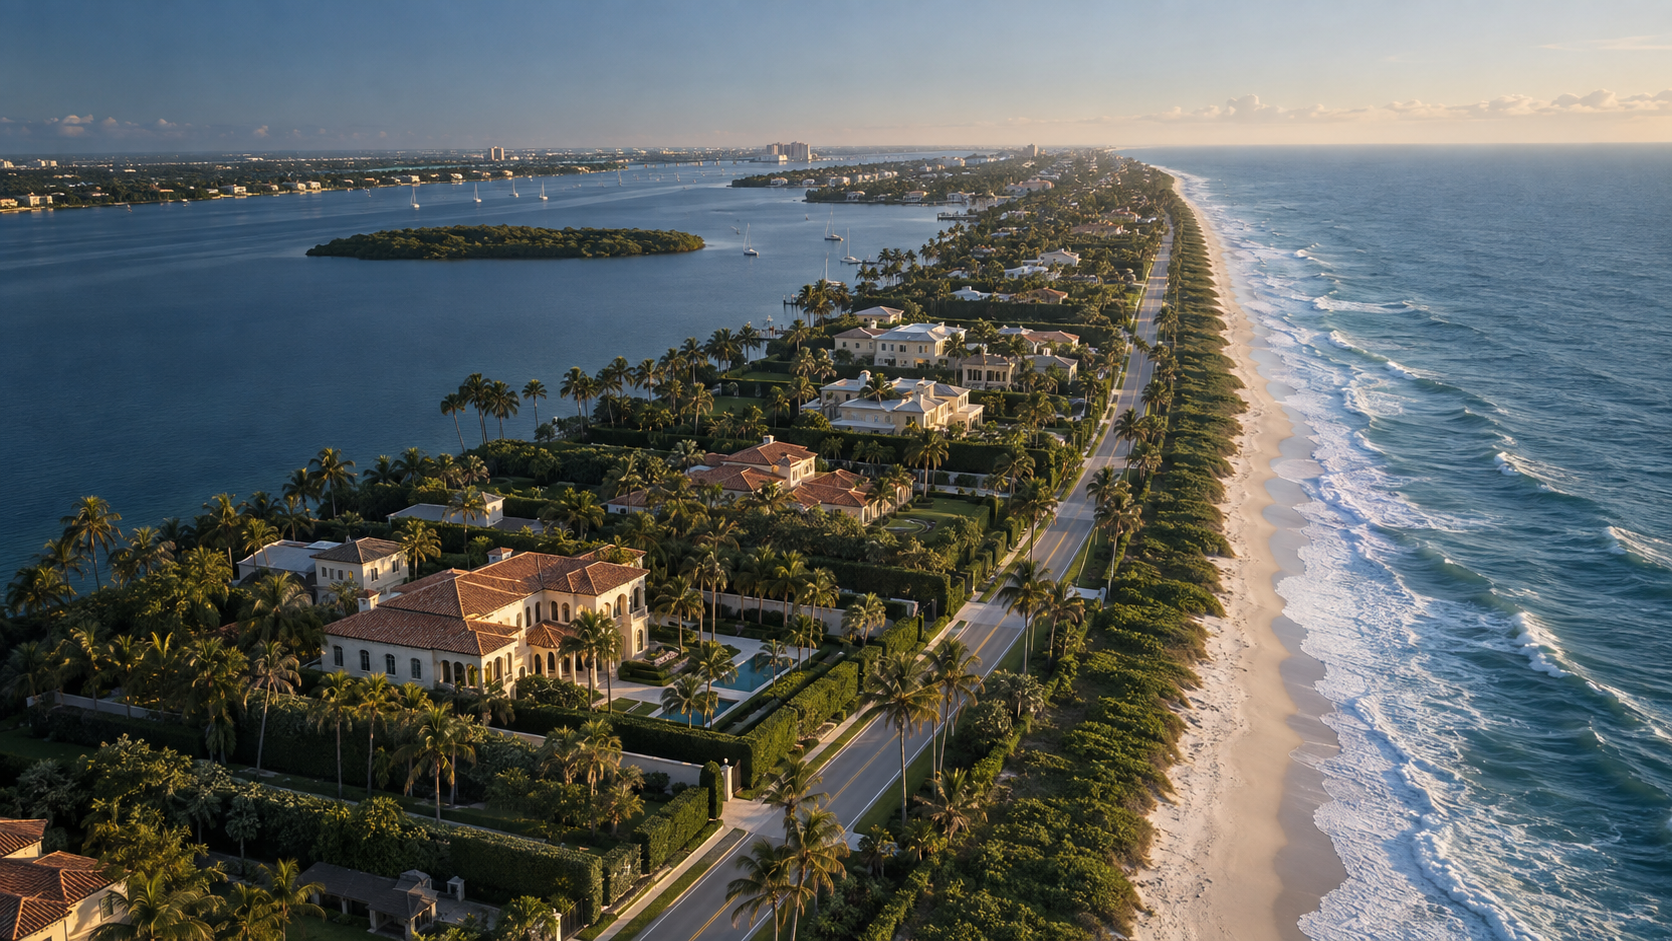
The Atlantic · Palm Beach · The Intracoastal
The island at a glance
Data through September 18, 2026
Market figures describe a defined population—not the value of an individual property.
Palm Beach briefings
Read online or take the report with you.
Three concise guides to the place, the current buying market, and the decisions facing Palm Beach homeowners.
Introduction to Palm Beach and Manalapan
Current Palm Beach Buyer’s Market Report
Current Palm Beach Homeowners’ Report
The discipline
Know when the market is speaking—and when a property has left the average behind.
What the evidence can tell us
- Direction, scarcity, and transaction depth
- Differences among areas, price tiers, sizes, and vintages
- Marketing time, reductions, and sale-to-list behavior
- Whether a broad claim survives the complete record
What still requires judgment
- The correct comparable set for one property
- Land, frontage, orientation, privacy, and architecture
- Renovation, replacement, and buyer resistance
- The meaning of a quiet opportunity or private indication
North to south
Palm Beach is not one market.
Four areas. Different housing, daily life, buyer motivations, and meanings of value.
01Explore ↗02Explore ↗03Explore ↗04Explore ↗
The North End
Quiet lanes, beach access, docks—and the island’s rebuild engine.
Midtown & In-Town
The walkable heart around Worth Avenue and Royal Palm Way.
The Estate Section
The grand quarter of landmark estates, grounds, and trophy parcels.
The South End
Ocean views and lock-and-leave living toward the Inlet.
Latest market intelligence
The Island in Three Sections
A candid reading of the North End, Midtown & In-Town, and the Estate Section—including the evidence against the thesis.
The record shows a genuine 2023–2024 correction, followed by a return to near the 2022 peak. It also shows a selective market: nearly half of concluded listing attempts since 2024 did not produce a sale.
Read the reportMedian sold $ / sq. ft.2019–2026 YTD
* 2026 is partial-year data. Annual medians reflect sales mix and modest sample sizes.
For buyers
Buy the property, not the island average.
The island has repriced. Individual properties still negotiate. Understand the tiers, the areas, the public inventory, and the quiet market before deciding where to act.
Read the buyer’s briefing ↗For owners
A strong market still discriminates.
Exceptional demand does not mean every listing succeeds. Pricing, presentation, timing, privacy, and the first comparable set determine the result.
Read the owner’s briefing ↗