
Sellers often ask us whether they should wait for “season” to list. The answer starts with a distinction: a contract month is not a listing month. Buyers signed most often in March across these featured markets. Many of the homes they chose were already on the market.
Spring brings more contracts
| Full-year period | Peak contract month | February–April share | Next-busiest window outside February–April |
|---|---|---|---|
| 2015–2019 | March (11.7%) | 32.7% | May–July (25.0%) |
| 2020, shown separately | June (11.2%) | 18.0% | June–August (28.8%) |
| 2021–2025 | March (12.4%) | 34.1% | May–July (22.7%) |
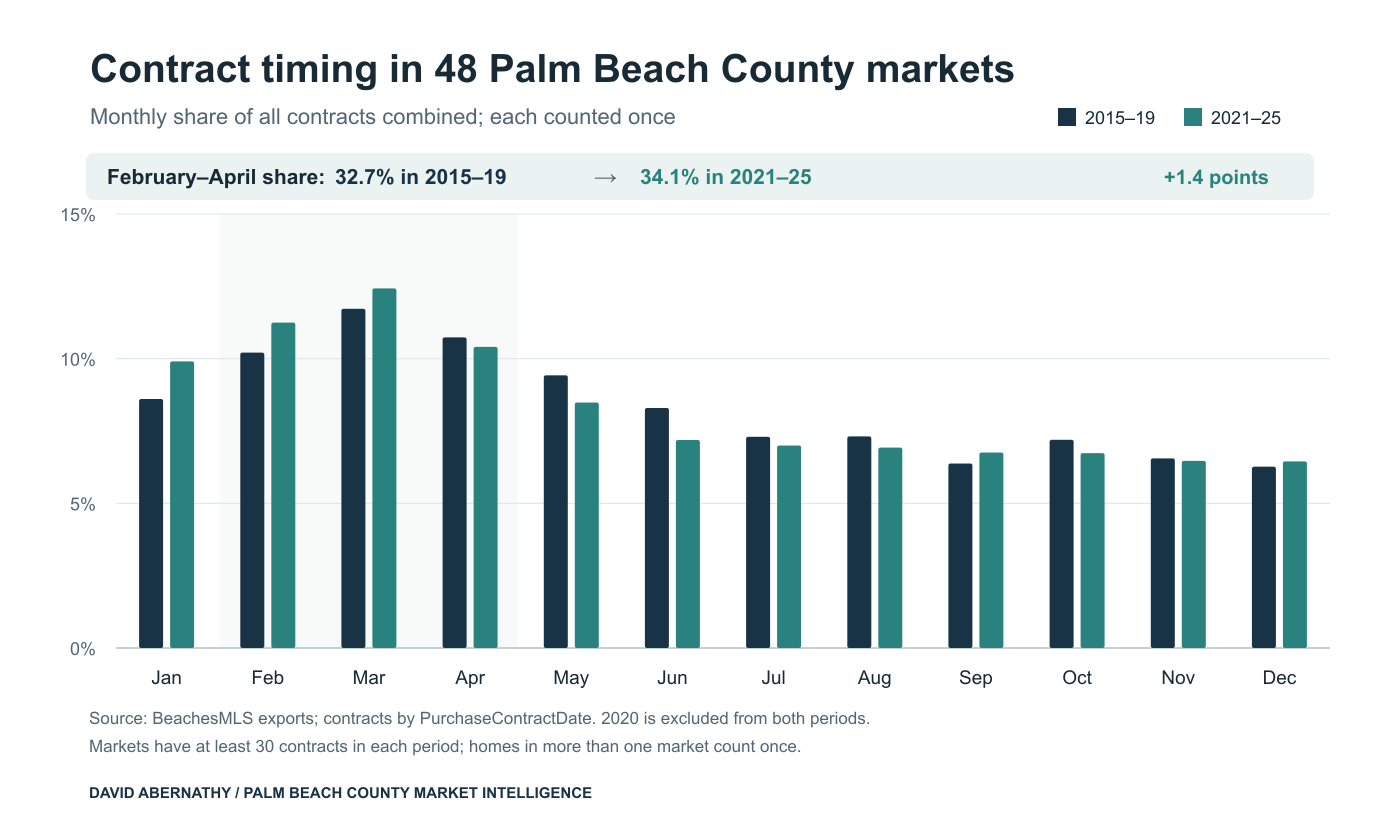
The February–April window gained about 1.4 percentage points between the two five-year periods. The next-busiest three-month window, with February, March, and April excluded, was May–July in both periods and became less prominent. The 2020 disruption is shown on its own instead of being folded into either comparison.
The recent years varied: across all 55 markets, the spring share was 31.3% in 2023, 35.8% in 2024, and 28.7% in 2025. March remained the busiest individual month in each year. In 2025, February–April contracts fell to 711 from 859 in 2024 while total annual contracts stayed near 2,400. The lower spring share appeared in all four market collections, and September–November activity increased. The records show the timing shift, but not its cause; we will watch whether it persists.
List before the buyers you hope to meet
Among 2,253 homes that went under contract in February–April of 2023–2025, later closed, and had usable listing dates, the median recorded listing date was around February 2 of the contract year. February was the most common single listing month (24%); nearly one-third had been listed in an earlier year. For homes under contract in March, the median listing date was around February 8.
That argues for starting the preparation early, especially if photography, repairs, pricing work, or a move will take time. The recorded on-market date describes the listings that sold; it does not identify an ideal launch date. We would set that date after looking at the active competition and recent contract pace for your specific property.
Did spring sellers get better terms?
| Contract period | Closed sales | Median sale-to-list | Median sold price per living sq. ft. | Median days to contract |
|---|---|---|---|---|
| February–April | 2,326 | 94.9% | $418 | 36 |
| Other months | 4,974 | 94.9% | $414 | 35 |
Spring brought more contracts, but these closed sales show no meaningful advantage in the ratio to the final recorded list price. The groups took about the same time to reach contract (36 versus 35 days). The small difference in median sold price per square foot is a raw comparison of different homes; it does not show that the same home would sell for more in spring. Sale-to-list ratios also depend on asking strategy and any price changes before contract.
The type of market changes the conversation
| Collection | Closed sales in this collection | Median sale-to-list | Median days to contract |
|---|---|---|---|
| Country clubs | 4,570 | 94.6% | 32 |
| Distinctive communities | 2,313 | 96.0% | 37 |
| Waterfront homes | 286 | 91.4% | 69 |
| Palm Beach Island | 184 | 89.7% | 101 |
All four collections still reached their recent contract high in March. Their sales, however, did not move at the same speed or sell at the same ratio to asking price. Palm Beach Island and waterfront properties had much longer median times to contract than the country club group. These figures describe different homes and asking strategies; they are a reason to use the right peer set, not a ranking of seller performance. Some homes appear in more than one collection, so these rows should not be added together.
Individual communities can depart from the broad curve. In 2023–2025, Woodfield Country Club had 40 March contracts out of 221, while Addison Reserve peaked in January with 20 out of 107. Boca West Country Club was much flatter: August had 85 contracts and March had 84 out of 690. Avenir had 37 May contracts, compared with 21 in March, out of 247.
Palm Beach Country Estates shows why we check more than one interval. November led its 2021–2025 calendar with 26 contracts out of 223, but in 2023–2025 June led with only 14 and several other months were close behind. A single peak month can shift when a smaller market is viewed over a shorter period.
Price ranges reveal a second high-end season
| Final recorded asking-price range | Contracts | February–April | May–July | October–December |
|---|---|---|---|---|
| $0–$1M | 3,506 | 32.3% | 23.6% | 18.9% |
| Over $1M–$3M | 2,610 | 30.5% | 23.3% | 21.6% |
| Over $3M–$5M | 525 | 33.0% | 22.1% | 21.5% |
| Over $5M–$10M | 406 | 33.3% | 25.9% | 21.9% |
| Over $10M | 296 | 35.5% | 16.6% | 28.4% |
Spring remains important above $10 million, but the October–December share is much larger than it is below $1 million. About two-thirds of the contracts above $10 million were in Palm Beach Island or waterfront market groups. Within country clubs alone, the October–December share above $10 million was 19.8%, close to 18.5% below $1 million. In other words, the late-year contrast largely reflects where the high-priced homes are, not a universal rule that expensive homes sell late in the year.
Our read is that the early part of the winter season gives some high-end buyers a reason to act before year-end. That is a practical hypothesis, not something the MLS export can prove: the records do not identify buyers as seasonal residents. For an island or waterfront seller, we would still examine the fall competitive set instead of automatically waiting for March.
| Final recorded asking-price range | 2015–2019 contracts | February–April share | 2021–2025 contracts | February–April share |
|---|---|---|---|---|
| $0–$1M | 10,628 | 32.1% | 7,412 | 34.0% |
| Over $1M–$3M | 2,037 | 34.6% | 4,107 | 31.1% |
| Over $3M–$5M | 540 | 35.2% | 944 | 36.7% |
| Over $5M–$10M | 316 | 35.4% | 702 | 37.5% |
| Over $10M | 112 | 30.4% | 477 | 38.2% |
The longer comparison confirms that spring does not strengthen uniformly in every price range. The $1M–$3M band became less concentrated in February–April, while the bands above $3 million became more concentrated. These are fixed dollar ranges across a decade of changing prices and property mix, and the earlier $10M-plus group contains only 112 contracts. We would not read the shifts as a pure change in buyer preference.
What this means for your home
The calendar helps us plan exposure; it does not price a property. For a country club home, a March-heavy contract pattern may make early preparation especially useful. For a waterfront or Palm Beach Island home, the longer sales cycle and late-year activity may widen the sensible launch window. For a smaller community, a few transactions can move the apparent peak, so current competing listings deserve extra weight.
Common questions
What is the best month to sell a home in Palm Beach County?
March was the busiest contract month in this selected-market analysis, but the listing date usually came earlier. The best launch date for a particular home depends on its peer inventory, presentation, and preparation time.
When should I list to go under contract in spring?
Among homes that went under contract in February–April 2023–2025 and later closed, the median recorded listing date was around February 2 of the contract year. February was the most common listing month, but the right launch date depends on preparation and competing homes.
Do homes sell for more in spring?
We found no clear spring advantage in sale-to-list ratio. Raw sold price per square foot varied with the homes sold, so this analysis does not establish a spring price premium for comparable properties.
How we measured it
We reviewed BeachesMLS exports for 55 featured markets: 29 country clubs, nine waterfront groups, 13 distinctive communities, and four Palm Beach Island areas. Contracts are assigned to the month of PurchaseContractDate; overlapping contracts are counted once in each pooled analysis. For the historical comparison, we use the same 48 markets with at least 30 contracts in each five-year period and pool their distinct contracts. The recent-year snapshot, price tables, and closed-sale outcomes pool distinct contracts or sales across all 55 markets. Closed-sale outcomes use transactions with a recorded closing; sale-to-list is closing price divided by the final recorded list price, sold price per living square foot is closing price divided by positive living area, and days to contract is the interval from OnMarketDate to PurchaseContractDate. That interval is a proxy, not official cumulative MLS days on market. Waterfront groups exclude condos and co-ops; other collections include all residential property types. Full-year comparisons stop at 2025 because 2026 is partial.
MLS file last updated: September 21–28, 2026, depending on market. Each export's exact update time and source ID are recorded in the analysis workbook and audit files.