For a condominium buyer, the purchase price is only part of the cost of ownership. The monthly association bill can materially change the budget, and comparing that bill across differently sized apartments requires a consistent measure.
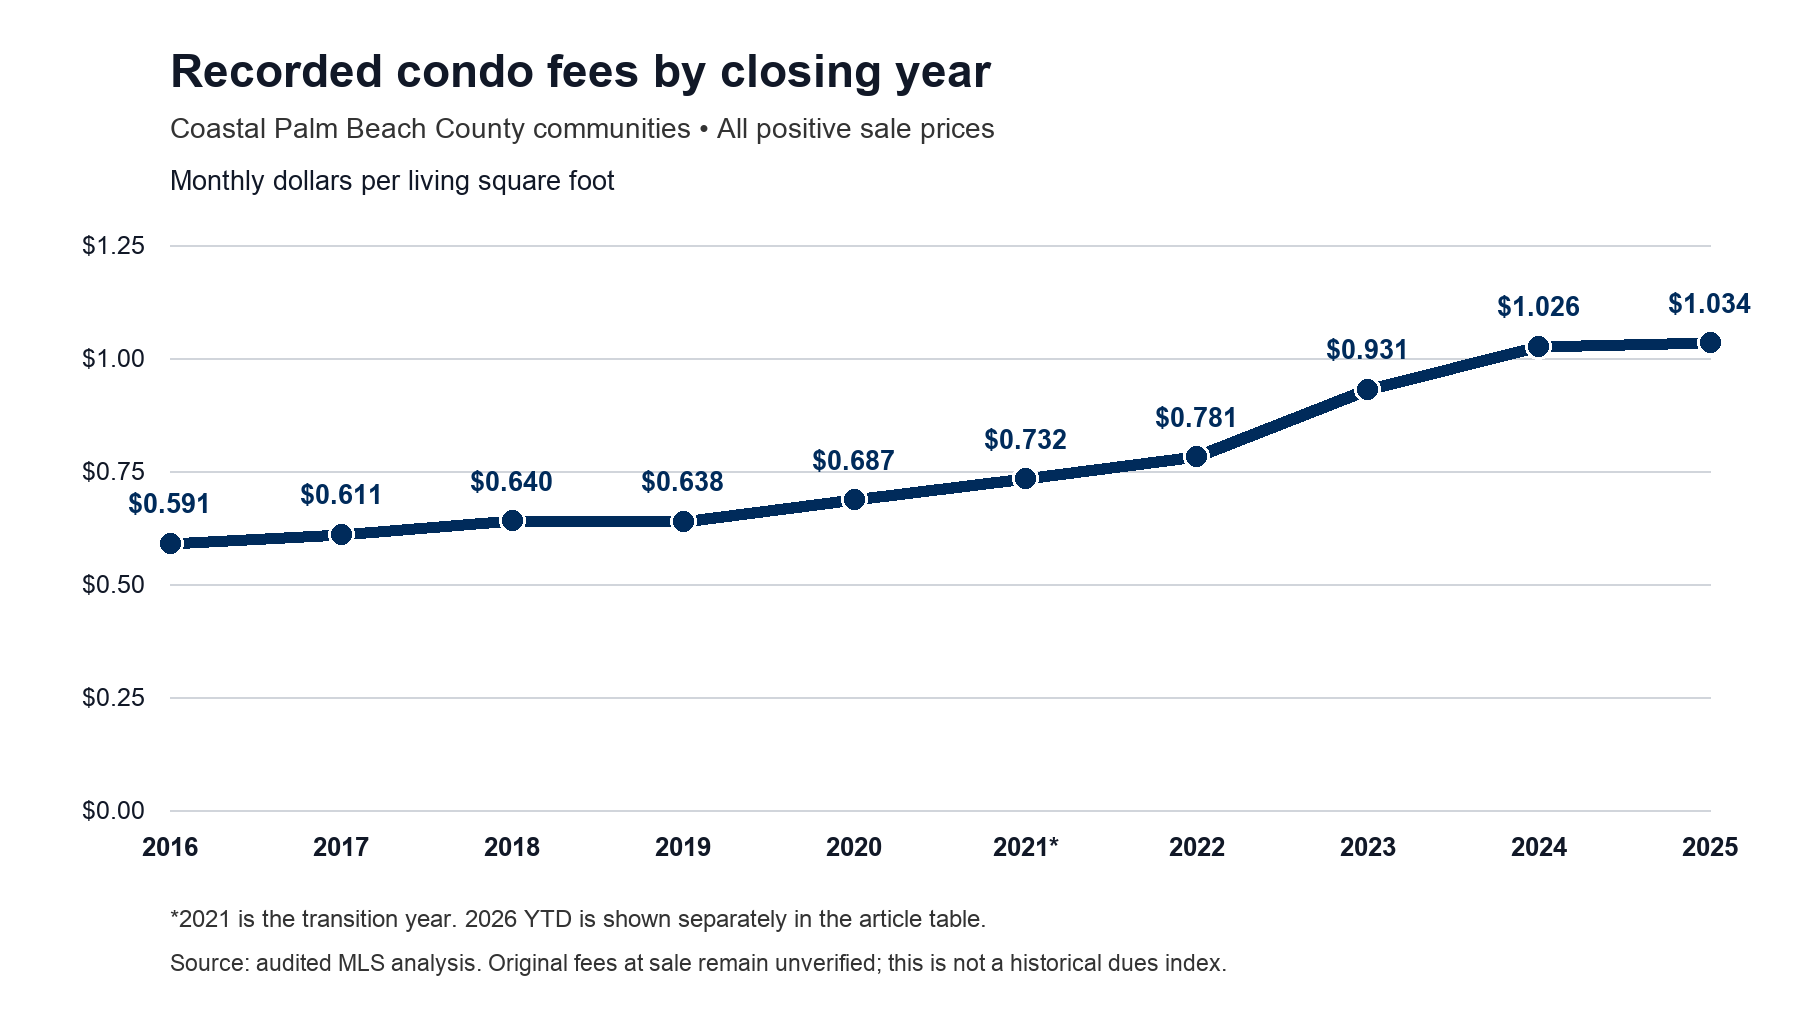
An analysis of coastal Palm Beach County condominium sales examined each sold unit’s recorded monthly association fee divided by its reported living square footage. It included all positive sale prices, rather than only luxury transactions. Across the 2016–2025 calendar-year windows, the median rose from $0.591 to $1.034 per living square foot per month—a difference of approximately 75%.
That result requires an important qualification: the supplied MLS exports do not establish whether older transactions retain the original fee at sale. Later record modification neither proves nor disproves fee overwriting. These figures are closing-year comparisons of recorded MLS fields, not a verified historical dues index or evidence that an individual owner’s bill increased 75%.
The annual record
| Closing year | Median | Change* | Usable / total sales |
|---|---|---|---|
| 2016 | $0.591 | — | 493 / 495 |
| 2017 | $0.611 | +3.4% | 427 / 430 |
| 2018 | $0.640 | +4.8% | 516 / 519 |
| 2019 | $0.638 | -0.2% | 501 / 506 |
| 2020 | $0.687 | +7.5% | 565 / 572 |
| 2021 transition | $0.732 | +6.7% | 929 / 936 |
| 2022 | $0.781 | +6.7% | 564 / 567 |
| 2023 | $0.931 | +19.1% | 442 / 444 |
| 2024 | $1.026 | +10.2% | 394 / 394 |
| 2025 | $1.034 | +0.8% | 497 / 498 |
| 2026 YTD | $1.191 | +21.0% | 394 / 396 |
*Changes use unrounded medians. Full-year rows compare with the preceding calendar year. The 2026 YTD figure runs through September 20 and compares with the same 2025 window. 2021 is the transition year.
The largest recent movement in the recorded annual medians occurred in 2023 and 2024: approximately 19% and 10%, respectively. The 2025 median changed less than 1%. The 2026 YTD median reached $1.191, but that partial-year sample belongs in a separate comparison. Easing insurance-market pressures may have helped moderate expenses in 2025, but this remains a hypothesis. Florida OIR reported downward trends in residential rate filings during 2024 and 2025; these filings do not establish what happened to the association master policies in this sample. Association insurance renewals and budgets would be needed to determine whether savings contributed to the slowdown. Read OIR’s July 2025 report.
Changing sales mix can influence these results. Different buildings sell in different years, and the same apartment can move between price brackets. The analysis therefore also examined a fixed panel of 50 communities with usable sales in every 2016–2025 window, alongside repeat-unit evidence. Among 431 repeat pairs, the median recorded fee-per-square-foot change was about 40%; among 306 pairs with identical reported living area, it was about 36%. Holding area constant improves comparability, but does not resolve fee-field provenance. These changes span varying intervals and are not annualized.
The exports contain an association-fee field, but do not separately identify master dues, recurring assessment payments or insurance allocations. Although 723 primary sale records contain assessment, reserve, milestone or structural terms in their remarks, those mentions are not confirmed assessments or documented amounts. The data cannot attribute the recorded movement to insurance or establish that post-Surfside requirements caused it.
For buyers, the figures provide a useful benchmark. A particular condominium still requires its own current budget, reserve information, assessment resolutions and payment schedule. Those documents establish what the association charges and which obligations remain outstanding.
Source and scope: Audited development MLS exports and tax records; common closing-date cutoff September 20, 2026, America/New_York. The mapped universe covers 93 of 95 master-list entries, with 5,757 retained sales and 5,722 usable ratios. Bristol and the unresolved Jupiter Ocean Club entry remain outside coverage. Tax records supported matching and quality checks; tax condo area was not substituted for living area. Missing or nonpositive fees and living areas were excluded from ratios. Conflicting transaction groups were quarantined. Source timestamps do not establish complete transaction coverage.
Broader context and building variation
While individual budget drivers are not itemized in MLS data, the recorded 2023–2024 fee movements occurred during a broader period of rising reported property-insurance premiums in Florida and the introduction, beginning in 2022, of milestone-inspection and structural reserve requirements for qualifying condominium buildings. This timing provides context; it does not establish how much either factor contributed to any building’s recorded fee change.
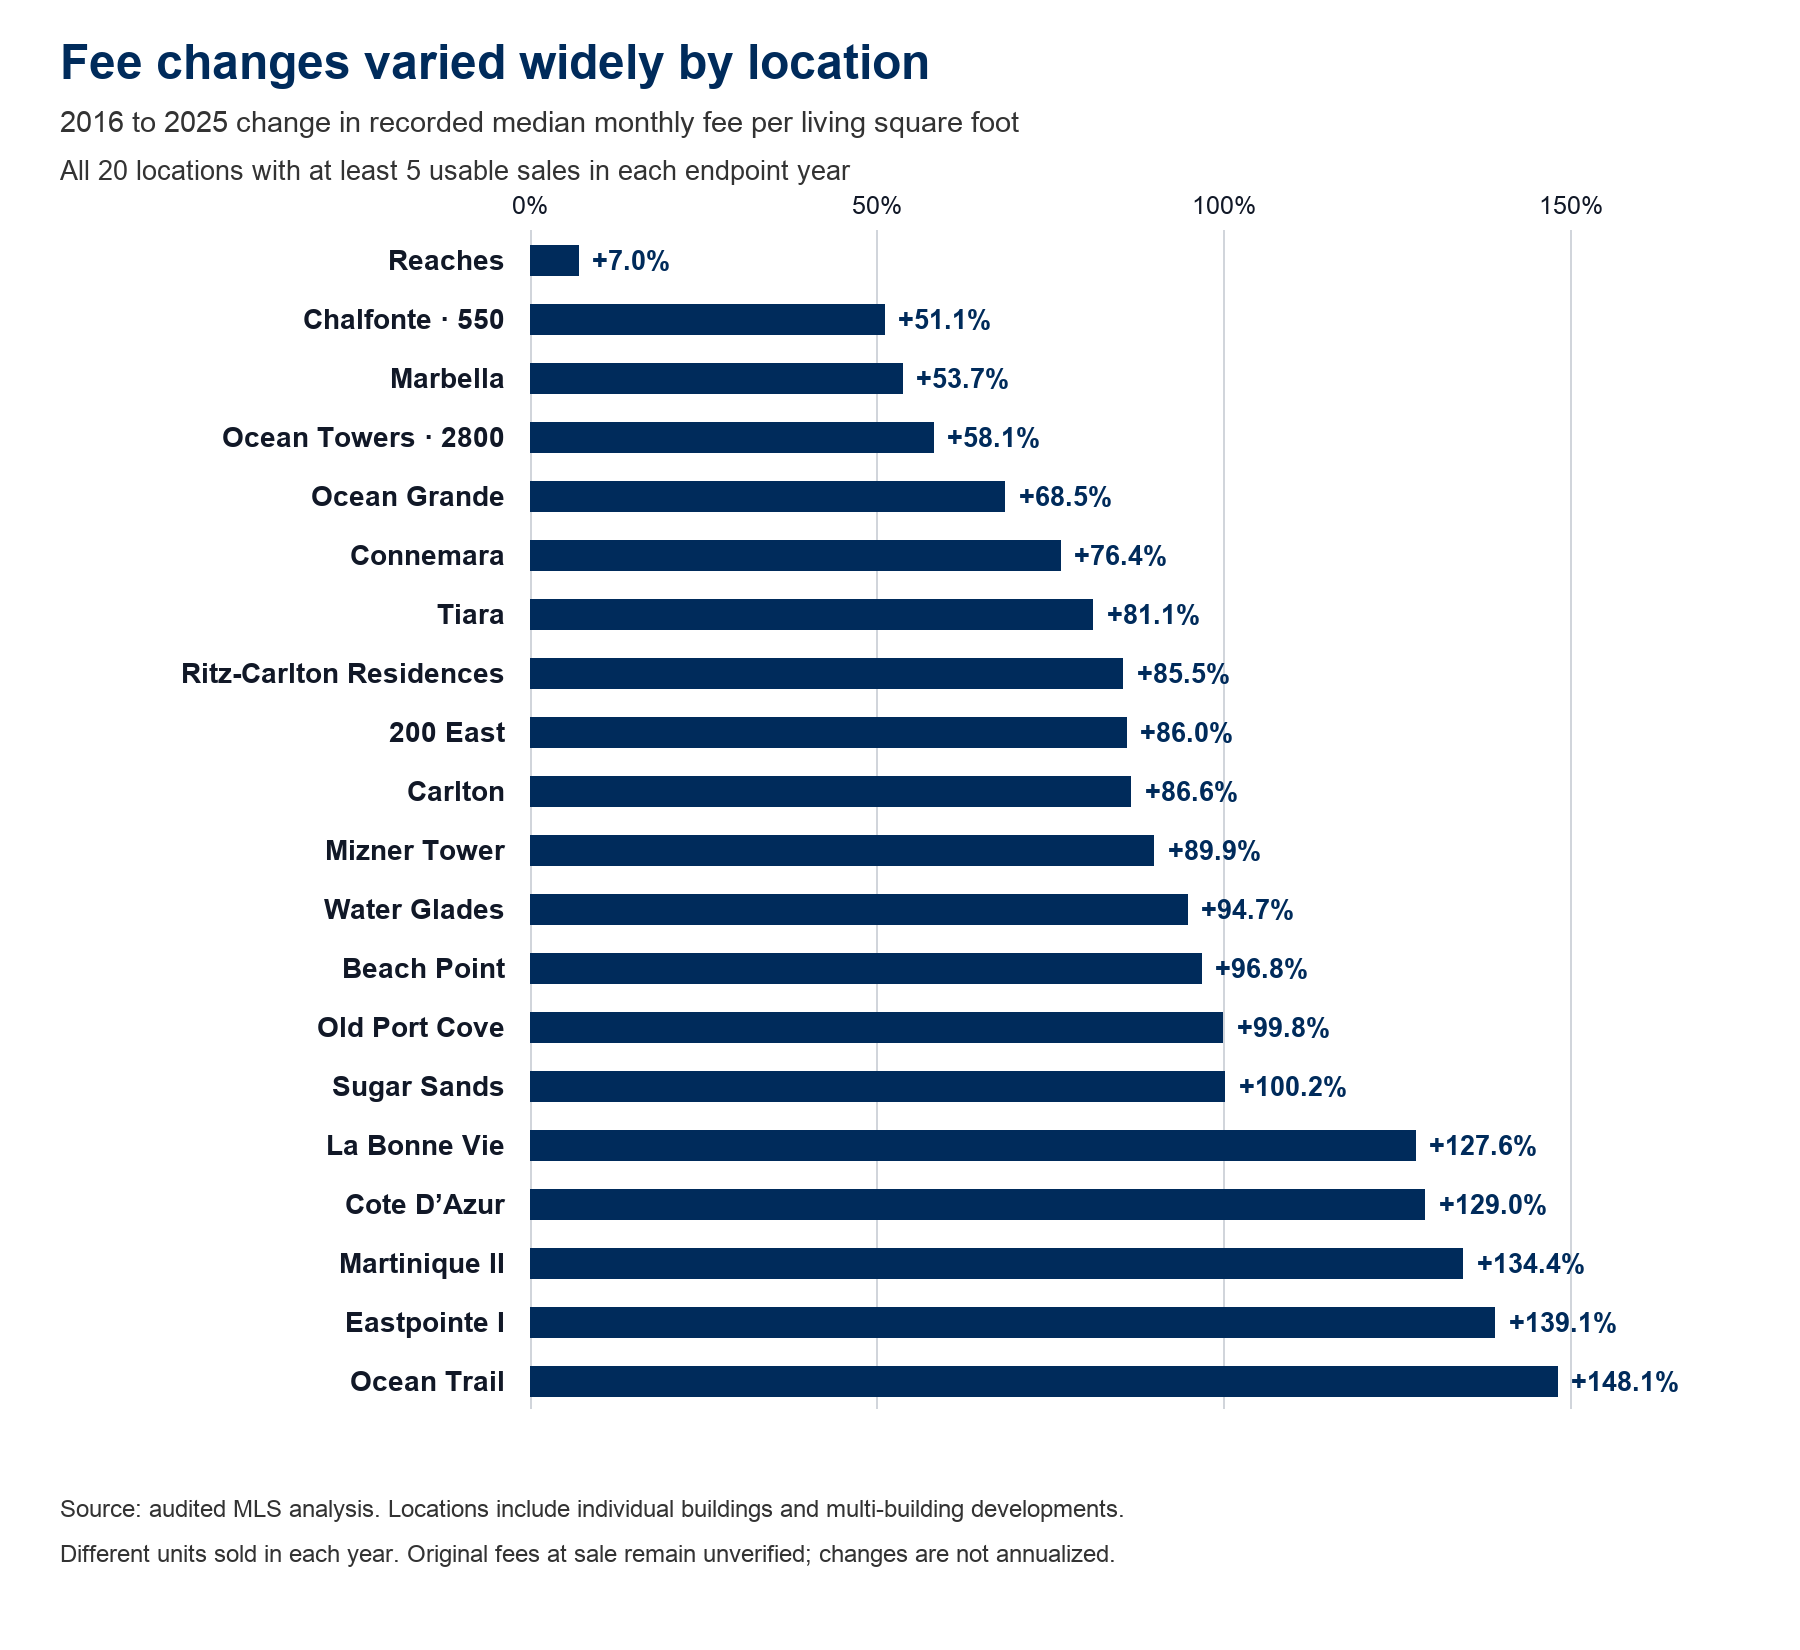
The recorded fee changes were far from uniform. Among the 20 buildings and developments with at least five usable sales in both 2016 and 2025, the endpoint differences ranged from about 7% at Reaches to 148% at Ocean Trail—a spread of approximately 141 percentage points. Chalfonte at 550 recorded about 51%, Tiara 81%, Water Glades 95%, and Martinique II 134%. These are comparisons of location-level sale medians, not verified association-budget increases.
Context sources: Florida OIR, January 2023 Property Insurance Stability Report and July 2024 report (county premium tables); Florida Senate, SB 4-D (2022). The insurance tables describe homeowners and individual condo-unit policies, not association master policies. Legislative requirements have since been amended.
Building and development comparisons
The table includes every location meeting the endpoint sample rule, ordered by percentage change. Medians are monthly dollars per living square foot and use all positive sale prices. A development label may cover multiple buildings; this is not a certified tower-by-tower comparison.
| Building / development | 2016 median | 2025 median | Change | Usable sales 2016 / 2025 |
|---|---|---|---|---|
| Reaches | $0.548 | $0.587 | +7.0% | 6 / 6 |
| Chalfonte · 550 | $0.697 | $1.053 | +51.1% | 7 / 13 |
| Marbella | $0.800 | $1.230 | +53.7% | 5 / 5 |
| Ocean Towers · 2800 | $0.587 | $0.928 | +58.1% | 10 / 8 |
| Ocean Grande | $0.594 | $1.001 | +68.5% | 5 / 8 |
| Connemara | $0.536 | $0.945 | +76.4% | 8 / 6 |
| Tiara | $0.634 | $1.148 | +81.1% | 12 / 6 |
| Ritz-Carlton Residences | $0.797 | $1.479 | +85.5% | 6 / 10 |
| 200 East | $0.679 | $1.263 | +86.0% | 9 / 5 |
| Carlton | $0.639 | $1.193 | +86.6% | 6 / 5 |
| Mizner Tower | $0.844 | $1.603 | +89.9% | 9 / 7 |
| Water Glades | $0.591 | $1.150 | +94.7% | 21 / 11 |
| Beach Point | $0.721 | $1.418 | +96.8% | 5 / 5 |
| Old Port Cove | $0.444 | $0.887 | +99.8% | 55 / 49 |
| Sugar Sands | $0.427 | $0.854 | +100.2% | 28 / 21 |
| La Bonne Vie | $0.561 | $1.276 | +127.6% | 6 / 7 |
| Cote D’Azur | $0.466 | $1.067 | +129.0% | 17 / 7 |
| Martinique II | $0.403 | $0.946 | +134.4% | 14 / 7 |
| Eastpointe I | $0.499 | $1.194 | +139.1% | 10 / 8 |
| Ocean Trail | $0.620 | $1.537 | +148.1% | 23 / 17 |
Explore the coastal condo collection. Linked names open dedicated condo market-data pages covering sales, inventory and building information; those pages use their own reporting periods. The fee comparisons are specific to this article. Dedicated reports are not currently published for Connemara, Sugar Sands, Cote D’Azur, Eastpointe I or Ocean Trail.
The contrast matters in dollars as well as percentages. Reaches moved from $0.548 to $0.587 per living square foot per month in the recorded samples. Ocean Trail moved from $0.620 to $1.537. The 2025 recorded medians also differed materially: Reaches was $0.587, while Mizner Tower was $1.603. Neither percentage movement nor current fee level alone establishes value, financial health or the services included.
Interpretation: The minimum sample threshold is a display safeguard, not proof of statistical significance. Some endpoint samples contain only five or six sales. Different unit sizes, unit types and fee components can influence medians even within a location. These comparisons are not repeat-unit changes, causal estimates, or evidence that Reaches avoided costs or Ocean Trail incurred a particular assessment. Original fee-at-sale records and association documents are needed to establish historical dues changes and their causes.